Key Points
- Glomerular filtration rate (GFR), estimated GFR (eGFR), creatinine clearance (CrCl), and urine output are key methods to evaluate kidney function.
- Urinalysis, including dipstick analysis and sediment examination, helps detect early signs of kidney disease.
- Blood levels of endogenous filtration markers, such as creatinine and cystatin C, are used to estimate GFR.
- It is recommended that the 2021 chronic kidney disease-epidemiology (CKD-EPI) creatinine equation be used to estimate the GFR in the clinical setting.
Introduction
- The kidneys play a vital role in sustaining extracellular fluid balance, which is vital for normal cellular activity. This is achieved by filtering metabolic waste products (i.e., urea, creatinine, uric acid) and adjusting water and electrolyte excretion based on the body’s intake and internal production. Solutes such as sodium, potassium, and hydrogen are regulated independently through changes in tubular absorption and secretion.1
- Assessing kidney function is essential for diagnosing and managing kidney diseases, monitoring treatment responses, and tracking disease progression.
- This summary will focus on assessing renal function, including urinalysis, serum blood urea nitrogen (BUN) and creatinine levels, CrCl, and estimation of GFR.
Urine Output
- Urinary output (UO) is a key indicator of kidney function and physiological status. Assessing UO can help determine a patient’s hydration level and guide clinical management.
- Normal UO typically ranges between 0.5 and 1.0 mL/kg/h.2
- Please see the OA summaries on perioperative oliguria and acute kidney injury (AKI) for more details.
Urinalysis
- Urinalysis is a widely available, noninvasive test that aids in diagnosing, monitoring, and detecting kidney disease, often revealing early signs even in asymptomatic individuals. A urinalysis comprises three parts: gross assessment of the urine, urine dipstick analysis, and microscopic examination of the urinary sediment.3
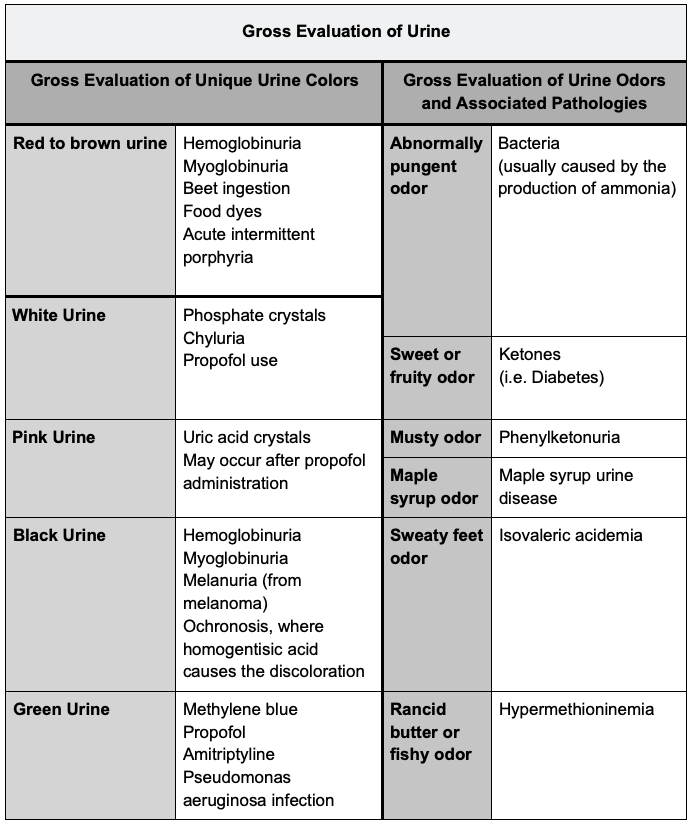
Gross Evaluation of Urine
- Urine color typically varies from light yellow when dilute to darker hues when concentrated, with red or brown discoloration indicating potential underlying issues.3
Urine Dipstick Analysis
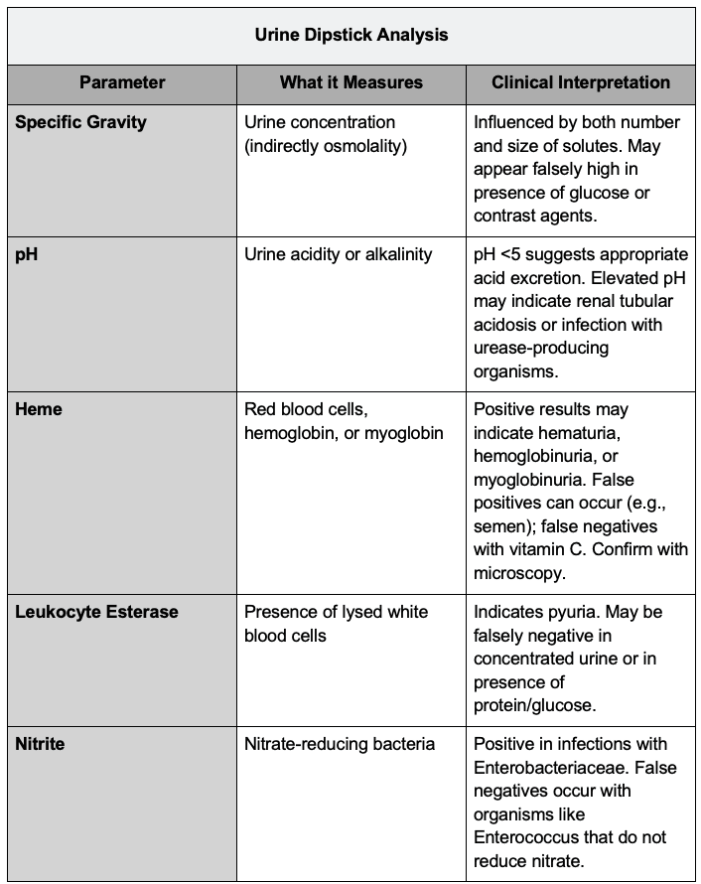
- Urine dipstick testing provides a rapid, semiquantitative evaluation of urine components, including specific gravity, pH, blood, leukocyte esterase, nitrite, albumin, and glucose.3


Urine Sediment
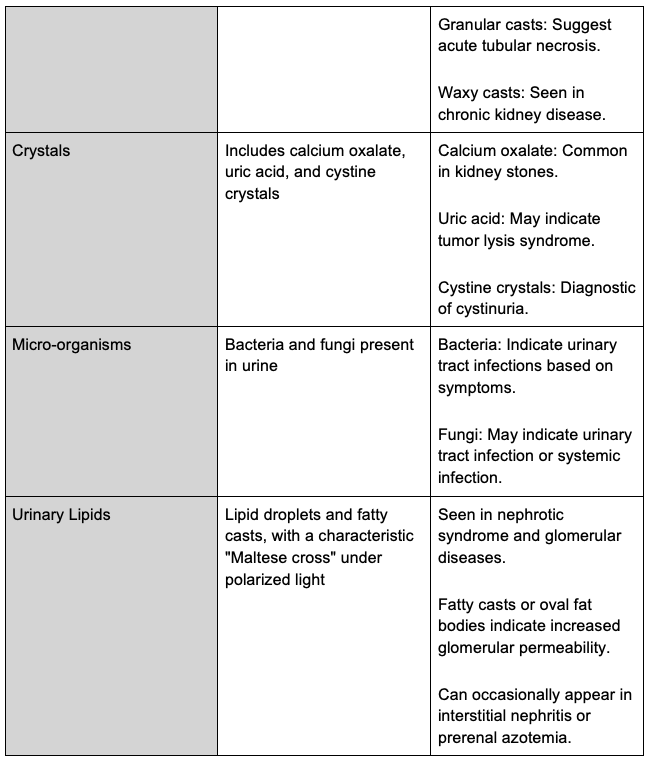
- Urine sediment examination involves centrifuging 10–15 mL of urine, discarding the supernatant, and resuspending the pellet. A small drop of the sediment is placed on a slide and covered with a coverslip. Brightfield microscopy is used, with possible enhancement through a Sternheimer-Malbin stain. Initial scanning is done with a 10x objective, followed by a 40x objective for detailed examination. Polarized light and phase contrast may be used as needed.

FeNa
- The FeNa is valuable for distinguishing between acute tubular necrosis and prerenal uremia.1

Figure 1. Fractional excretion of sodium equation.1
- FeNa values below 1% typically indicate a prerenal etiology, while values exceeding 2% suggest intrinsic renal causes. A urinary sodium concentration of less than 20 mmol/L also supports the diagnosis of prerenal AKI.1
- Several online FeNa calculators are available. For example: Link.
BUN
- Urea is synthesized in the liver, where ammonia produced from amino acid deamination is converted to prevent toxic accumulation.4
- BUN levels normally range from 10 to 20 mg/dL, with lower values seen in starvation or liver disease. Elevated BUN is typically due to reduced GFR or increased protein catabolism, which may result from trauma, sepsis, gastrointestinal blood loss, large hematomas, or high-protein diets.4
- BUN reflects protein catabolism and is inversely related to GFR, making it unreliable for GFR assessment unless protein breakdown is stable. Approximately 40–50% of urea is reabsorbed by renal tubules, with this fraction increasing in hypovolemia.4
- BUN levels above 50 mg/dL are commonly associated with impaired kidney function.4
Creatinine
- Creatine is a byproduct of muscle metabolism that is nonenzymatically converted to creatinine.4
- Daily creatinine production is relatively constant, averaging 20–25 mg/kg in men and 15–20 mg/kg in women, and is primarily linked to muscle mass.4
- Creatinine is filtered by the kidneys, with minimal secretion and no reabsorption. Therefore, serum creatinine levels correlate with muscle mass and are inversely related to GFR.4
- In stable individuals, serum creatinine serves as a reliable marker of GFR. However, in critically ill patients, creatinine production and distribution may be altered, limiting the accuracy of serum creatinine as a GFR indicator during AKI.4
Relationship between Creatinine and GFR
- Serum creatinine typically ranges from 0.8 to 1.3 mg/dL in men and 0.6 to 1 mg/dL in women.4
- A doubling of serum creatinine indicates a 50% reduction in GFR, as indicated in the graph below.4
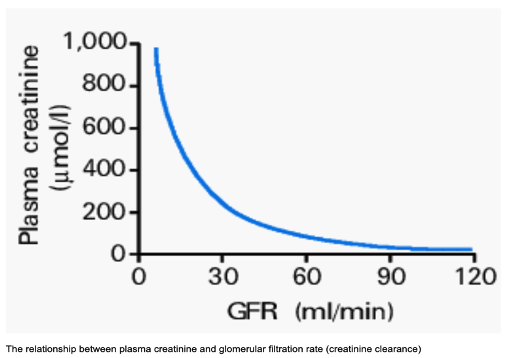
Figure 2. Glomerular filtration rate vs. plasma creatinine graph. Source: Glynne PA, et al. Clinical Medicine (London). 2001. CC BY-NC-ND 4.0 Link
- GFR naturally declines with age, but as muscle mass decreases, serum creatinine levels tend to remain stable, potentially masking significant reductions in kidney function in older adults.4
BUN Creatinine Ratio: Evaluation of Azotemia
- Azotemia refers to increased nitrogenous waste products, such as BUN, typically ranging from 7 to 21 mg/dL, and creatinine in the bloodstream and other secondary metabolic byproducts.5
- Prerenal azotemia results from reduced kidney perfusion due to factors like shock, dehydration, hemorrhage, excessive diuresis, burns, or conditions causing low oncotic pressure, such as heart or liver failure.5
- BUN: Cr ratio > 20:1
- FeNa < 1%
- Intrinsic azotemia arises from kidney structural damage, affecting the glomeruli, tubules, interstitium, and vasculature, often due to inflammation, toxins, drugs, infections, or hypoperfusion.5
- BUN: Cr ratio < 20:1
- FeNa > 2%
- Postrenal azotemia results from urinary tract obstruction, often in the ureters or bladder, typically seen in patients with risk factors like recurrent UTIs, nephrolithiasis, hydronephrosis, or benign prostatic hyperplasia.5
- BUN: Cr ratio < 20:1
- FeNa > 2%
- Prerenal azotemia results from reduced kidney perfusion due to factors like shock, dehydration, hemorrhage, excessive diuresis, burns, or conditions causing low oncotic pressure, such as heart or liver failure.5
CrCl

Figure 3. Cockcroft-Gault Formula creatinine clearance.6
- CrCl is a practical and affordable approach to evaluate kidney function, involving the measurement of blood plasma cleared of creatinine, based on urine creatinine, serum creatinine, and urine volume over a designated time period.1
- CrCl is a precise method for assessing GFR, typically measured over 24 hours, though 2-hour measurements are also accurate and more convenient.4
- CrCl values should be adjusted for body surface area to ensure accuracy. Inaccurate or incomplete urine collection can lead to significant errors, so precise timing of the collection is critical. Additionally, due to creatinine’s tubular secretion, GFR is often overestimated by 10-20%.1
- Mild kidney dysfunction corresponds to clearances of 40–60 mL/min, while values between 25–40 mL/min indicate moderate dysfunction with symptoms. Clearances under 25 mL/min suggest severe kidney failure.4
- In advanced kidney disease, increased creatinine secretion leads to overestimation of GFR. Compensatory hyperfiltration may preserve GFR despite renal decline. Therefore, other signs of kidney dysfunction, such as hypertension, proteinuria, or urine sediment abnormalities, should also be monitored.4
GFR
- The GFR reflects the rate at which the kidneys filter fluid. While inulin clearance is considered the most accurate method for determining GFR, it is impractical due to its invasiveness and high cost.
- The GFR is defined as the cumulative filtration occurring across all functional nephrons within the kidneys. Filtration occurs in the glomeruli, which are responsible for processing roughly 180 liters of plasma daily, corresponding to an estimated rate of 125 mL per minute.8
- Normal GFR values vary depending on individual characteristics, including age, sex, and body surface area. In general, a typical range in healthy individuals is between 90 and 120 mL/min/1.73 m², or approximately 140 to 173 liters per day per 1.73 m² of body surface area, though physiological variation is common.8
- Since a patient’s true GFR cannot be measured directly, it is determined from clearance measurement of serum levels of filtration markers, including endogenous and exogenous solutes. Creatinine and cystatin C are the most commonly used endogenous markers.
eGFR
- eGFR is commonly calculated using serum and urine creatinine levels.
- The 2021 CKD-EPI creatinine equation is currently favored for eGFR in clinical practice due to its removal of the race coefficient present in earlier models. This change, supported by organizations such as the American Society of Nephrology and the National Kidney Foundation, reflects a shift toward more equitable clinical assessments and acknowledges the limitations of using race as a variable in medical algorithms.8

Figure 4. 2021 Chronic kidney disease-epidemiology creatinine equation8
- To calculate a patient’s eGFR, please check out this calculator from the National Kidney Foundation. Link
- Although this updated equation may be marginally less precise than the 2009 version, it remains appropriate for clinical use.8
- When available, cystatin C measurements are recommended to verify eGFR, particularly in patients whose creatinine levels may be influenced by factors unrelated to kidney function, such as muscle mass, diet, or chronic illness.8
- The adoption of the 2021 formula slightly alters the estimated prevalence of CKD across populations, raising estimates among Black patients and lowering them in others.
- It also helps minimize racial disparities in projected risk for end-stage kidney disease at similar eGFR levels, though some variability persists when cystatin C is incorporated.8
- Other GFR estimation equations, including the revised Lund-Malmö and EKFC models, have been developed using European cohorts and require adaptation for use in diverse populations. Additionally, unique challenges exist in assessing kidney function in East Asian populations, where region-specific calibration factors are sometimes applied. In such cases, cystatin C-based estimates may offer improved accuracy without requiring race- or region-based adjustments.8
References
- Gounden V, Bhatt H, Jialal I. Renal function tests. In: StatPearls [Internet]. Treasure Island (FL): StatPearls Publishing; 2025. Link
- Al-Kazwini H, Simhadri PK. Normal and abnormal urine output and interpretation. In: StatPearls [Internet]. Treasure Island (FL): StatPearls Publishing; 2025. Link
- Wald R. Urinalysis in the diagnosis of kidney disease. In: UpToDate. March 26, 2025. Accessed April 27, 2025. Link
- Butterworth JF, Mackey DC, Wasnick JD. Chapter 31: Anesthesia for Patients with Kidney Disease. In: Morgan and Mikhail’s Clinical Anesthesiology,7e. McGraw Hill Medical; 2025. Accessed April 26, 2025.
- Tyagi A, Aeddula NR. Azotemia. [Updated 2023 May 14]. In: StatPearls [Internet]. Treasure Island (FL): StatPearls Publishing; 2025. Link
- Shahbaz H, Rout P, Gupta M. Creatinine Clearance. [Updated 2024 Jul 27]. In: StatPearls [Internet]. Treasure Island (FL): StatPearls Publishing; 2025. Link
- Butterworth JF, Mackey DC, Wasnick JD. Chapter 30: Kidney Physiology. In: Morgan and Mikhail’s Clinical Anesthesiology,7e. McGraw Hill Medical; 2025. Accessed April 26, 2025.
- Inker LA, Perrone RD. Assessment of kidney function. In: Post T, ed. UpToDate. 2024. Accessed April 17, 2025. Link
Copyright Information

This work is licensed under a Creative Commons Attribution-NonCommercial-NoDerivatives 4.0 International License.