Key Points
- The bedside inferior vena cava (IVC) ultrasound examination can be used to assess right atrial pressures and provides gross clues to intravascular volume status.
- The IVC can be imaged from two subcostal locations (anterior and right flank) and in the long- or short-axis at each location. But most validation data have been performed using the subxiphoid long-axis view.
- When assessing the IVC, it is essential not to confuse it with the aorta, which runs parallel to it. The IVC is most accurately differentiated from the aorta by a combination of ultrasound findings rather than any single data point.
Clinical Utility
The bedside IVC ultrasound examination can be used to assess right atrial pressures and provides gross clues to intravascular volume status. The character and size of the IVC, in combination with other sonographic findings, can also assist in diagnosing various pathologies such as tamponade.
Technique
Patient Positioning and Probe Selection
- A low-frequency probe such as a curvilinear or a transthoracic (colloquially called a “phased-array”) probe should be used when visualizing the IVC. In general, lower frequency 2.0—5.0 MHz curvilinear and transthoracic probes allow better penetration and imaging of deeper structures.
- The examination should be performed with the patient in the supine position. If possible, instruct the patient to bend their knees up and place the soles of their feet flat on the bed to facilitate relaxation of the abdominal wall.
Probe Positioning and Views
- The IVC is most commonly imaged in its long-axis plane via the anterior subcostal window. For the ease of image acquisition, the examiner can start by obtaining the subcostal four-chamber view. To obtain the subcostal four-chamber view, the probe is placed under the subxiphoid region, slightly right of the midline. The transducer index marker is pointed toward the patient’s left, around the 3 o’clock position (Figure 1A). Once the four-chamber view is obtained, rotate the probe 90 degrees in a counter-clockwise direction to visualize the long-axis view of the IVC as it enters the right atrium (Figure 1B). The indicator should now be pointing toward the patient’s head (Figure 1C).
- To optimize this image, use small motions to fan the probe side to side or tilt the tail of the probe up or down. Instructing the patient to take a deep breath and hold it can also be helpful.
- Adjust the depth to ensure adequate visualization of the IVC. Optimal depth varies with patient body habitus but consider starting at 10-12 cm and adjusting as needed.

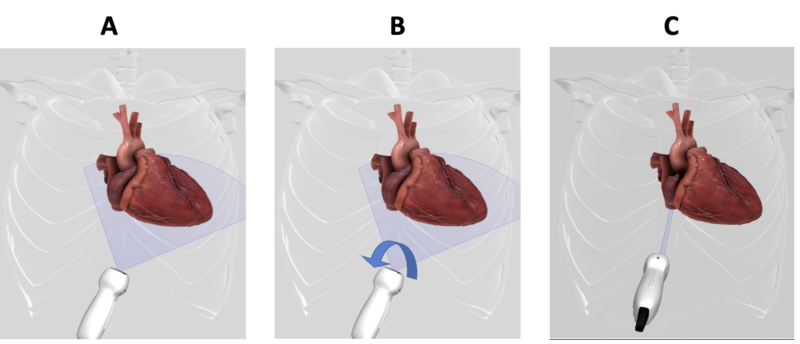
Figure 1. (A) To obtain the subcostal four-chamber view, the transthoracic (aka “phased array”) probe is placed in the subxiphoid region of the abdomen with the index marker pointing towards the patient’s left around 3 o’clock position (B). The probe is rotated 90 degrees in a counter-clockwise direction to visualize the long-axis view of the IVC as it enters the right atrium (C). The indicator will now be pointing cephalad.
Normal Sonoanatomy
- In the long-axis view of the IVC, the liver should be visible in the superficial regions of the screen, and the right atrium should be seen on the right. The IVC should appear as a thin-walled, hypoechoic structure spanning horizontally across the screen and entering the right atrium. Hepatic vascular structures are seen traversing through the liver and entering the IVC (Figure 2).
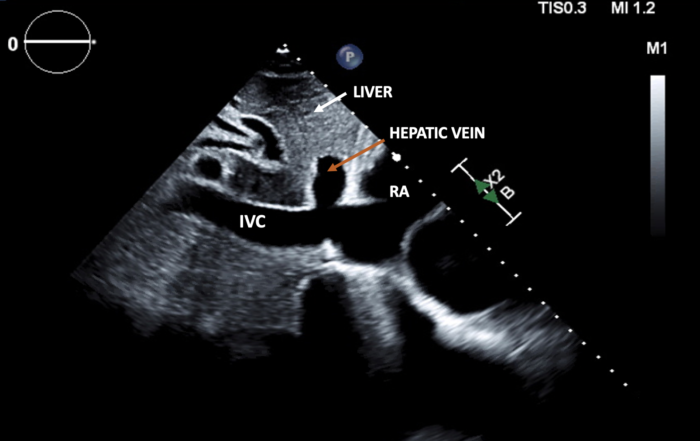
Figure 2. In the subxiphoid long-axis view of the IVC, the liver is seen at the top of the screen. The IVC appears as a thin-walled, hypoechoic, band-like structure spanning horizontally across the screen and entering the right atrium. Hepatic vascular structures are seen running through the liver and entering the IVC. (IVC: inferior vena cava; RA: right atrium).
Measurements
- The maximal IVC diameter and the respiratory variations in the IVC diameter values are used to estimate the right atrial pressure. Normally, during spontaneous respiration, the IVC collapses more than 50% during inspiration as the negative intrathoracic pressure results in the drainage of blood into the right atrium. As such, the inspiratory and expiratory diameters are the narrowest and widest points, respectively, in a spontaneously breathing patient.
- The measurement of the IVC diameter should be made 1-2 cm caudal to the junction where the hepatic veins drain into the IVC (Figure 3).1
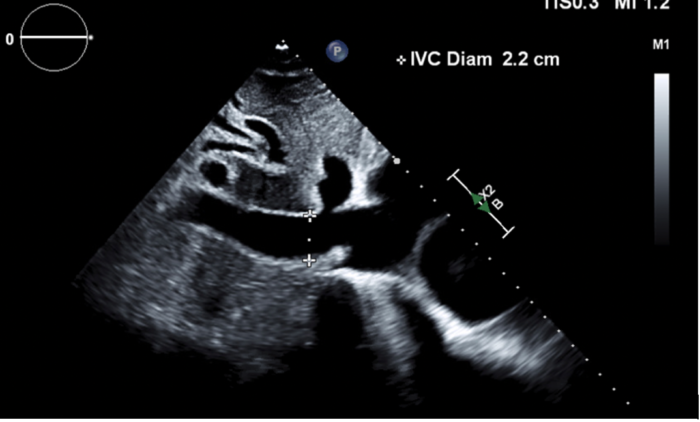
Figure 3. The IVC diameter is measured perpendicular to the long axis of the IVC at the location just proximal to the junction of the hepatic vein draining into the IVC.
- Respiratory variations in the IVC diameter can also be assessed using motion mode (M-mode) imaging. The M-mode interrogation beam is placed across the IVC 1-2 cm proximal to the hepatic vein confluence to obtain the IVC measurements (Figure 4).
- The maximum IVC diameter (dIVCmax) is measured as the maximum anterior-posterior dimension at end-expiration using the leading-edge technique (inner edge to inner edge of the vessel wall). The minimum IVC diameter (dIVCmin) is measured at end-inspiration (Figure 4).
- IVC collapsibility index (IVCCI) is calculated as IVCCI = (dIVCmax − dIVCmin)/dIVCmax and is expressed as a percentage.2
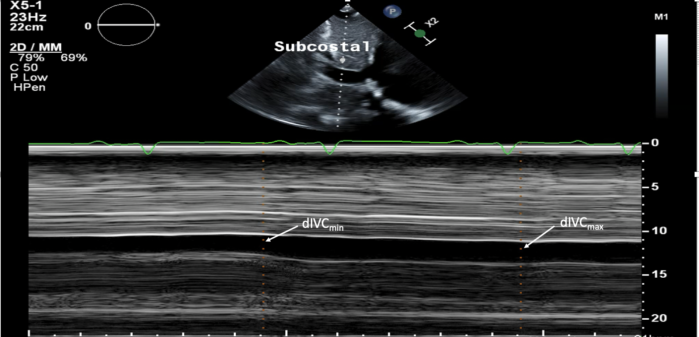
Figure 4. IVC diameter measurements obtained on M-mode. The maximum inferior vena cava diameter (dIVCmax) is measured as the maximum anterior-posterior dimension at end-expiration in a spontaneously breathing patient using the leading-edge technique (inner edge to inner edge of the vessel wall). The minimum inferior vena cava diameter (dIVCmin) is measured at end-inspiration.
- To estimate the right atrial pressure (RAP), the American Society of Echocardiography (ASE) recommends having the patient take a deep breath in or perform the sniff maneuver. For purposes of simplicity and standardization, ASE recommends reporting RAP as specific values rather than ranges. In general, in a patient with normal RAP, the maximal IVC diameter is expected to be less than 2.1cm and greater than 50% variation during the respiratory cycle. In patients with high RAP, the IVC maximal diameter would be expected to be more than 2.1cm with less than 50% respiratory variation (Table 1).3
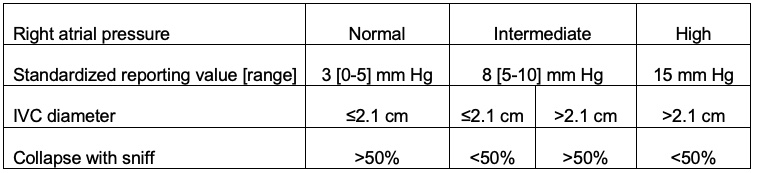
Table 1. Right atrial pressure estimation based on the maximal IVC diameter and respiratory variation values.3
Pitfalls
- When assessing the IVC, it is essential not to confuse it with the aorta, which runs parallel to it. The abdominal aorta and IVC can be differentiated based on a combination of sonographic findings (Table 2).4
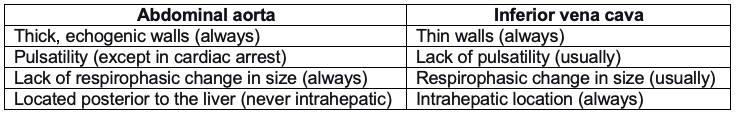
Table 2. Ultrasonographic findings to differentiate the abdominal aorta and inferior vena cava.
-
- Occasionally, the IVC will show pulsatility (e.g., in the case of moderate-to-severe tricuspid regurgitation) or lack of respirophasic change in size (e.g., in the case of severely elevated right atrial pressure). Thus, distinguishing the IVC from the abdominal aorta requires evaluation of multiple features of the vascular structure in question.
- Other features may help distinguish the IVC from the aorta, but they can be challenging to use practically. For example, in theory, only the IVC drains into the right atrium, whereas the abdominal aorta does not, but routinely the aorta appears continuous with anechoic spaces overlying the heart that are easily mistaken for the right atrium. Further, the IVC receives hepatic veins, whereas the aorta splits into mesenteric arteries, but these two types of blood vessels are often not clearly visible.
- When measuring IVC diameters on M-mode imaging, it is essential to ensure that the IVC does not translate out of the imaging plane during portions of the respiratory cycle, leading to a false estimation of IVC respiratory variation.3
References
- Rudski LG, Lai WW, Afilalo J, et al. Guidelines for the echocardiographic assessment of the right heart in adults: a report from the American Society of Echocardiography endorsed by the European Association of Echocardiography, a registered branch of the European Society of Cardiology, and the Canadian Society of Echocardiography. J Am Soc Echocardiogr. 2010; 23(7): 685-713. PubMed
- Zhang J, Critchley LAH. Inferior vena cava ultrasonography before general anesthesia can predict hypotension after induction. Anesthesiology. 2016;124(3): 580-9. PubMed
- Porter TR, Shillcutt SK, Adam MS, et al. Guidelines for the use of echocardiography as a monitor for therapeutic intervention in adults: a report from the American Society of Echocardiography. J Am Soc Echocardiogr. 2015;28(1): 40-56. PubMed
- Hoffman M, Convissar DL, Meng M, et al. Image acquisition method for the sonographic assessment of the inferior vena cava. J Vis Exp. 2023:13(191). PubMed
Copyright Information

This work is licensed under a Creative Commons Attribution-NonCommercial-NoDerivatives 4.0 International License.