Key Points
- Ultrasound image quality is optimized with appropriate probe selection and adjustment of depth, focus, frequency, and gain.
- Imaging artifacts arise when the ultrasound imaging system's data acquisition and signal-processing assumptions are violated.
- During an in-plane approach for a regional block or vascular access, the needle image is optimal when the needle is 90 degrees to the probe.
Ultrasound Principles
- Ultrasound machines pass electricity through a probe (transducer) containing piezoelectric crystals, producing an ultrasound wave that is transmitted to the patient. Waves are reflected back to the “listening” probe to interact with piezoelectric crystals, creating an electrical current that is processed to produce an image. The “listening” time corresponds to the target depth.1
- Ultrasound wave characteristics include wavelength and frequency.
- Wavelength is the distance between the ultrasound waves.
- Frequency is the number of ultrasound waves each second.
- Ultrasound waves are reflected, refracted, scattered, or absorbed by the internal structures (Figure 1). Waves reflected back to the probe generate a 2-dimensional image.
- Reflection: A percentage of the ultrasound waves “bounce” back to the probe after traveling between tissues of different acoustic impedances (Table 1).
- Refraction: Refraction refers to changes in ultrasound wave direction when a wave contacts the interface between different tissues.
- Scattering: Scattering refers to changes in ultrasound waves in any direction due to heterogeneous tissue or rough surfaces.
- Attenuation: Attenuation refers to a gradual loss of ultrasound energy traveling through tissue and is inversely related to frequency and image resolution caused by reflection, refraction, scattering, and absorption.1,2
- Echogenicity refers to the ability of a tissue to reflect an ultrasound wave and is a measure of acoustic reflectance. A very reflective tissue has a high acoustic impedance, resulting in more energy reflected to the probe.
- Tissues with high acoustic impedance result in a more reflective image (hyperechoic) with poor visualization below the highly reflective tissue. Tissues with low acoustic impedance result in a less reflective image (hypoechoic) with better visualization below the less reflective tissue. Thus, the image quality of the target area is dependent on the target’s acoustic impedance relative to surrounding tissues.1

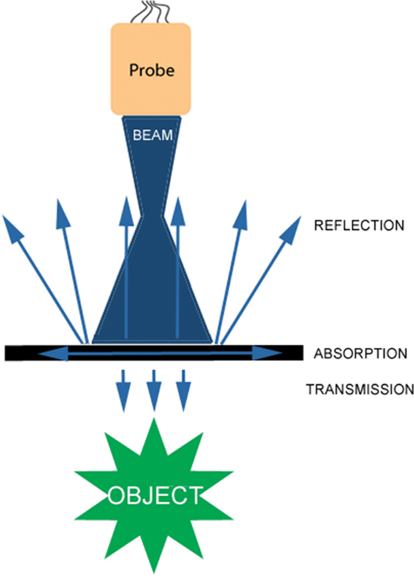
Figure 1. Reflection, absorption, and transmission of ultrasound waves. Used with permission from Le HT, et al. Imaging Artifacts in echocardiography. Anesth Analg. 2016;122(3):633-46. PubMed
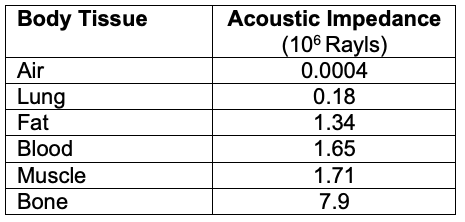
Table 1. Acoustic impedance of different body tissues
Ultrasound Image Optimization
Probe Selection
- Probes vary in wave frequency, field of view/trajectory of transmitted waves, and size/footprint.
- Linear
- Higher frequency → greater image resolution at the expense of decreased tissue penetration
- Best for shallow structures
- Waves are transmitted in a straight trajectory, allowing for equal image quality in the lateral field of view.
- Curvilinear
- Low frequency → greater tissue penetration at the expense of image quality
- Best for deep structures
- Waves are transmitted in a fanned trajectory; therefore, the image quality is best beneath the center of the probe.
- Phased Array
- Low frequency
- Waves are transmitted in a fanned trajectory from a narrow origin and allow imaging through small “windows” (i.e., between ribs).1,2
- Linear
Depth
- The target should be centered in the middle of the screen by adjusting the depth, thereby optimizing axial resolution, which is the ability to discern between two longitudinally adjacent objects.1
Frequency
- The frequency of the ultrasound probe should be manually adjusted depending on the depth of the target. Frequency and depth are not linked on the ultrasound machine.
- The highest frequency probe that still allows adequate penetration to the depth of the target of interest should be selected.6
Focus
- The focus of the ultrasound beam should be set at the level of the target of interest, thereby optimizing lateral resolution, which is the ability to discern two laterally adjacent objects.1
Gain
- Gain refers to the uniform amplification of waves returning to the probe, which controls image brightness. The gain should be adjusted so that vascular structures appear dark. Too much gain causes reverberation (see below).
- Time-gain compensation refers to the ability to control gain at specific image depths. It should be progressively increased as the depth of penetration increases to compensate for the corresponding loss of signal intensity.1
Color Doppler
- The ultrasound waves should be directed to the area of interest at an angle less than 90 degrees to identify fluid flow. A probe at 90 degrees does not alter reflected wave frequency (Doppler shift).1
Needle Angle
- During an in-plane approach for a regional block or vascular access, the needle image is optimal when the needle is 90 degrees to the probe.
Two-Dimensional Ultrasound Artifacts
- Artifacts are common when using ultrasound for echocardiography, point-of-care ultrasound, or regional anesthesia. Imaging artifacts arise when the data acquisition and signal-processing assumptions made by the ultrasound imaging system are violated (Table 2).3
- This summary will focus on two-dimensional ultrasound artifacts. Please see reference 3 for more details on Doppler artifacts and three-dimensional ultrasound artifacts.
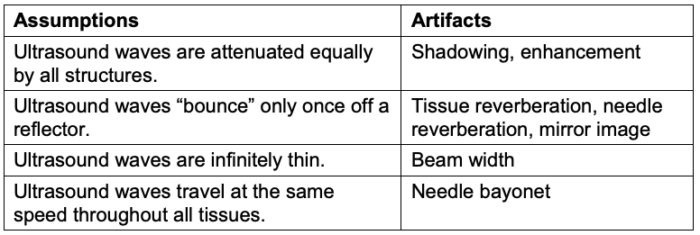
Table 2. Violations of ultrasound assumptions that lead to artifacts. Adapted from Le HT, et al. Imaging Artifacts in echocardiography. Anesth Analg. 2016;122(3):633-46. PubMed
Acoustic Enhancement and Shadowing
- Acoustic enhancement occurs when a shallower structure has lower acoustic impedance than a deeper structure, resulting in the deep structure appearing falsely more echogenic (Figure 2A and 3).3
- Acoustic shadowing occurs when a shallower structure has a higher acoustic impedance than a deeper structure, resulting in the deeper structure appearing falsely less echogenic (Figure 2B and 4).3
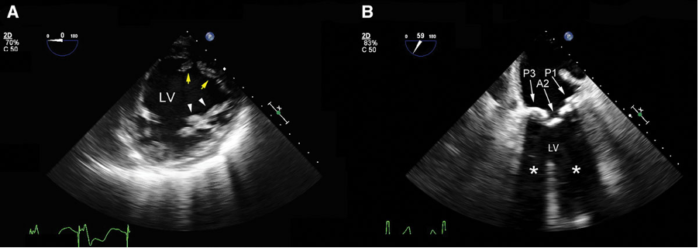
Figure 2. Mid-esophageal transgastric short-axis view of the left ventricle (LV). A: The posteromedial papillary muscle (yellow arrows) is displayed with the correct grayscale. Propagation of the ultrasound inside the fluid-filled LV results in a relatively brighter anterolateral papillary muscle (white arrowheads) secondary to enhancement. B: Shadowing (white asterisks) from heavily calcified posterior (P1 and PP3) and anterior (A2) mitral valve leaflets. The anechoic area distal to these structures prevents a thorough assessment of the LV wall motion. Used with permission from Le HT, et al. Imaging Artifacts in echocardiography. Anesth Analg. 2016;122(3):633-46. PubMed
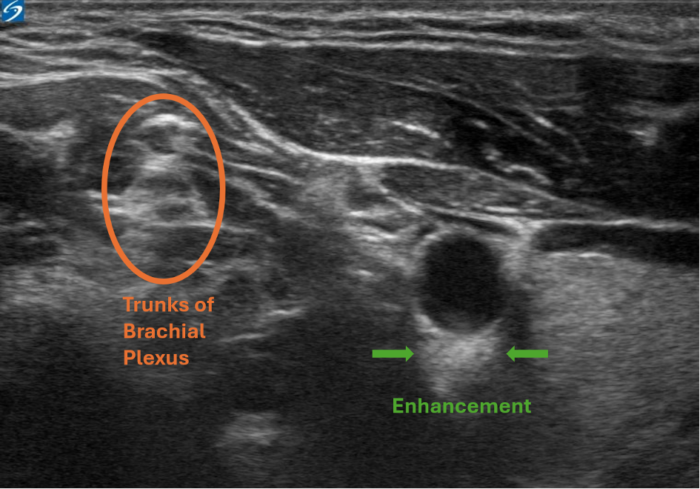
Figure 3. Enhancement artifact. This is a view of the interscalene nerve block. The enhancement artifact can be seen below the carotid artery, as the blood inside the vessel has a lower acoustic impedance than the artery's wall. This causes the arterial wall to appear more echogenic falsely. Image courtesy: Souhail Karram, MD
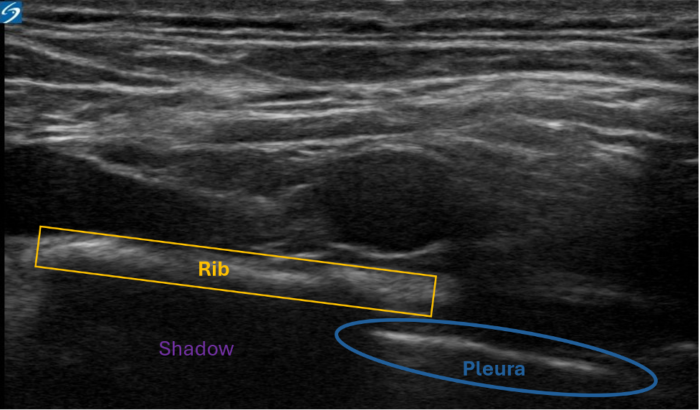
Figure 4. Shadowing artifact. Bone has a high acoustic impedance. The pleura (blue) is obscured by the rib (yellow). Despite the continuation of the pleura beneath the rib, the high impedance of the bone creates a shadow, preventing visualization of the pleura. Image courtesy: Souhail Karram, MD
Tissue Reverberation Artifacts
- Tissue reverberation artifacts occur when an ultrasound wave bounces between two highly reflective tissues, resulting in a longer “listening” time of ultrasound wave transmission. The more time the ultrasound machine “listens,” the deeper it assumes the structure resides.
- When the distance between the reflectors is minimal, the artifact appears as a “comet-tail” (Figure 5).3 Comet-tail artifacts have been reported with left atrial catheters, pacing wires, or pulmonary artery catheters.3
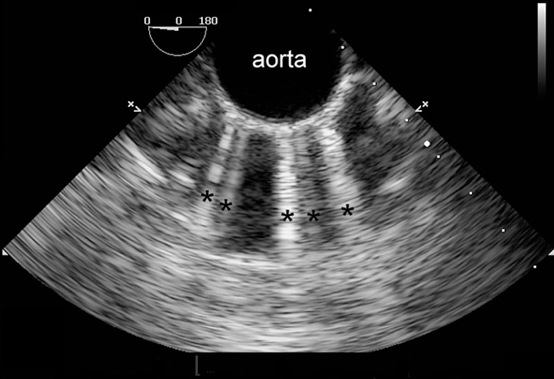
Figure 5. Multiple comet-tail artifacts (black asterisks) radiate from the anterior wall of the calcified descending aorta. Used with permission from Le HT, et al. Imaging Artifacts in echocardiography. Anesth Analg. 2016;122(3):633-46. PubMed
- Similarly, ring-down artifacts occur when bubbles within a fluid background reflect or resonate sound waves (Figure 6).3 The appearance of ring-down artifacts should alert the sonographer to the presence of gas (e.g., air embolism or post-cardiopulmonary bypass air).3
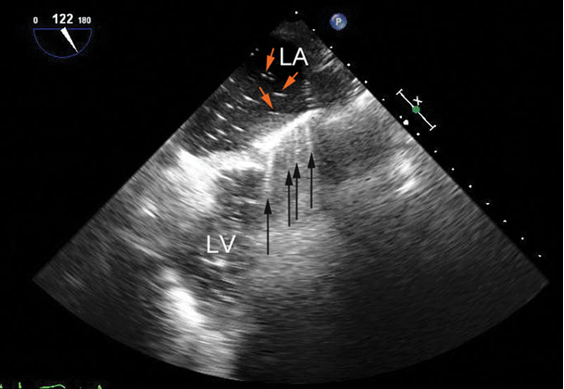
Figure 6. Mid-esophageal long-axis view before separation from cardiopulmonary bypass showing ring-down artifacts (black arrows) as a series of rays radiating from the anterior wall of the left ventricle (LV). They result from residual air bubbles (red arrows) inside the left atrium (LA). Used with permission from Le HT, et al. Imaging Artifacts in echocardiography. Anesth Analg. 2016;122(3):633-46. PubMed
Mirror-Image Artifacts
- Mirror image artifacts are similar to reverberation artifacts, where the ultrasound waves bounce between two reflectors. However, mirror-image artifacts occur when the ultrasound wave first bounces from a smooth reflective surface to the target to bounce back again to a smooth reflective surface before returning to the probe (Figure 7).3
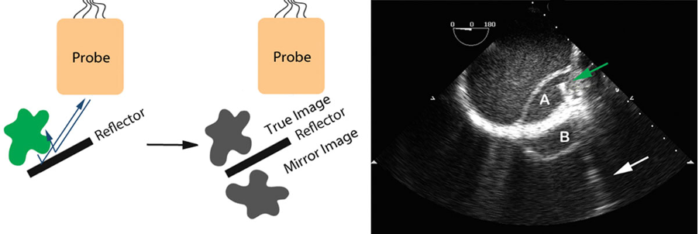
Figure 7. Mirror-image artifacts. A dissection flap (A) in the descending aorta with its mirror image (B) outside the aorta. The mirror surface is likely the thickened aortic wall. The green arrow points to a guidewire placed in the true lumen of the aorta with a comet-tail (white arrow) radiating away. Used with permission from Le HT, et al. Imaging Artifacts in echocardiography. Anesth Analg. 2016;122(3):633-46. PubMed
Beam Width Artifacts
- Beam width artifacts occur when the ultrasound beam width is wider than the distance between two side-by-side (laterally adjacent) structures, blurring the structures in the produced image (Figure 8). Adjusting the focal zone with the focus knob should eliminate these artifacts.3
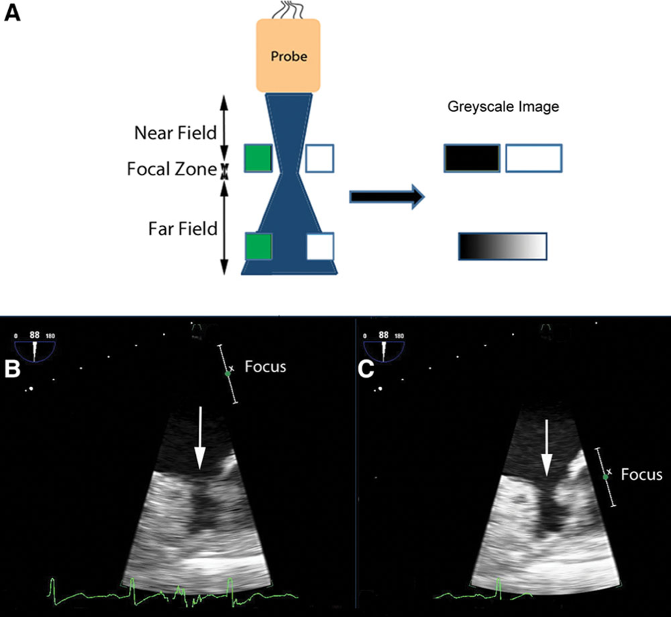
Figure 8. A: in the near field, the pair of targets is displayed as separate objects. The pair of targets in the far field is imaged at a depth where the ultrasound beam is wide. It is unclear in the displayed image if there are two targets or a single wide one. Panel B shows how beam width artifacts may be misdiagnosed as a thrombus in the left atrial appendage. The area of interest (white arrow) is in the far field of the ultrasound beam (B). As a result, the left atrial appendage may appear blurred, and a thrombus cannot be excluded. When the beam is narrowed by adjusting the focus, the echogenic material disappears (C). Used with permission from Le HT, et al. Imaging Artifacts in echocardiography. Anesth Analg. 2016;122(3):633-46. PubMed
Needle Reverberation Artifacts
- Needle reverberation artifacts are produced when an ultrasound wave bounces within the lumen of a regional block needle, making a duplicate image of the needle. This occurs most when the needle is 90 degrees to the probe (Figure 9).
- The angle of incidence can be adjusted to less than 90 degrees to reduce this artifact. However, as the needle becomes less perpendicular to the ultrasound beam, the needle shaft will become more challenging to visualize.6
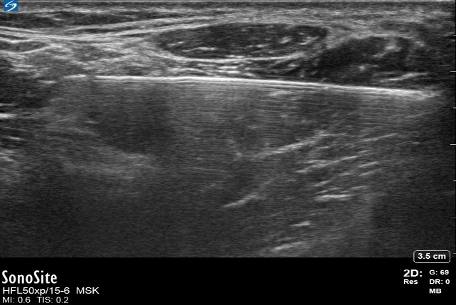
Figure 9. Needle reverberation artifact. Image courtesy: Souhail Karram, MD.
Bayonet Artifacts
- Bayonet artifacts occur when a regional block needle passes through tissues, which allows ultrasound waves to travel at differing speeds (Figure 10). Thus, the ultrasound machine produces an image of the needle at differing depths due to differing “listening” times. As a result, the needle appears bent or broken.
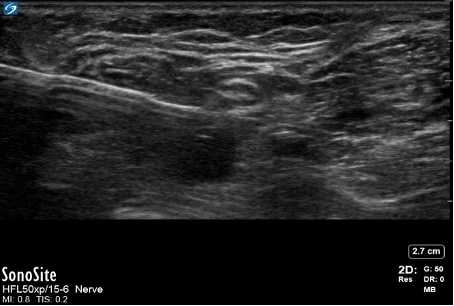
Figure 10. Needle bayonet artifact. Image courtesy: Souhail Karram, MD.
Probe-Skin Dropout Artifacts
- Since air does not conduct ultrasound, the ultrasound probe must fully contact the skin without any interfacing air, and a conductive gel is typically placed between the probe and the skin. When only a portion of the probe makes contact with the skin due to a size mismatch between the size of the probe and the anatomical region, a significant dropout is generated (Figure 11).6
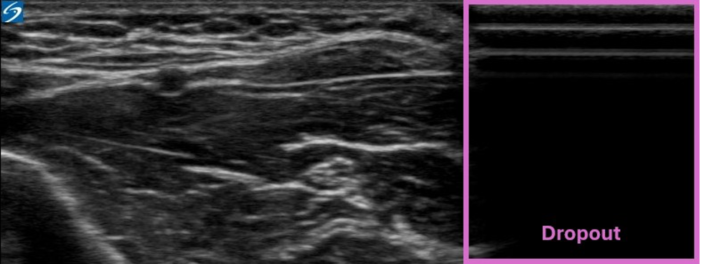
Figure 11. Dropout artifact. Image courtesy: Souhail Karram, MD.
Eliminating Ultrasound Artifacts
- Table 3 lists the characteristics of common two-dimensional ultrasound artifacts and strategies to eliminate them.
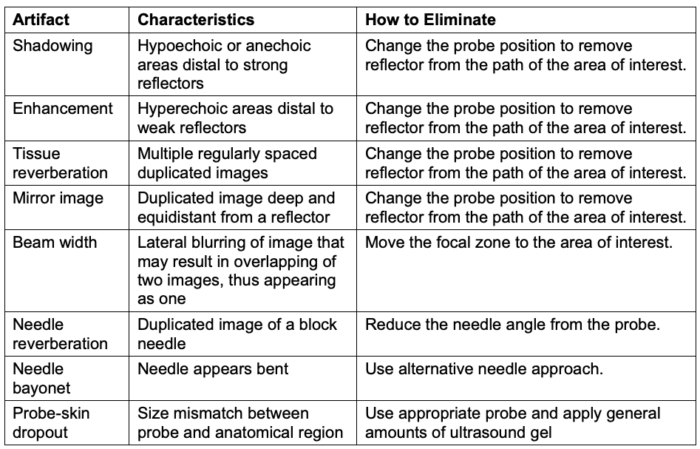
Table 3. Common ultrasound artifacts and strategies to eliminate them. Adapted from Le HT, et al. Imaging Artifacts in echocardiography. Anesth Analg. 2016;122(3):633-46. PubMed
References
- Sites BD, Brull R, Chan VW, et al. Artifacts and pitfall errors associated with ultrasound-guided regional anesthesia. Part I: understanding the basic principles of ultrasound physics and machine operations. Reg Anesth Pain Med. 2007;32(5):412-8. PubMed
- Grant SA, Auyong DB. Basic principles of ultrasound-guided nerve block. In: Ultrasound-Guided Regional Anesthesia. 2nd edition, New York, NY. Oxford University Press 2017.
- Le HT, Hangiandreou N, Timmerman R, et al. I am imaging Artifacts in echocardiography. Anesth Analg. 2016;122(3):633-46. PubMed
- Middleton WD, Kurtz AB, Hertzberg BS. Practical physics. In: Ultrasound: The Requisites. 2nd edition, St. Louis, MO: Mosby; 2004.
- Bushberg JT. Ultrasound. In: The Essential Physics of Medical Imaging. 3rd edition. Philadelphia, PA: WoltersKluwer/Lippincott Williams & Wilkins; 2012.
- Sites BD, Brull R, Chan VW, et al. Artifacts and pitfall errors associated with ultrasound-guided regional anesthesia: Part II: A pictorial approach to understanding and avoidance. Reg Anesth Pain Med. 2010;35(2 Suppl): S81-S92. PubMed
Copyright Information

This work is licensed under a Creative Commons Attribution-NonCommercial-NoDerivatives 4.0 International License.