Key Points
- Point-of-care testing with viscoelastic studies such as rotational thromboelastometry (ROTEM) and thromboelastography (TEG) provide a more comprehensive evaluation of the whole blood’s propensity (or lack thereof) to form a clot.1,2
- There is convincing evidence that implementing transfusion algorithms based on the results of viscoelastic point-of-care coagulation tests can reduce transfusions and lead to improved patient outcomes.3,4
- TEG and ROTEM have several advantages over traditional coagulation tests and is becoming an increasingly important tool in the management of patients with complex coagulation disorders.
Viscoelastic Tests
- Viscoelastic tests (VET), such as TEG or ROTEM, are laboratory tests used to assess the clotting ability of blood.5,6 These tests provide a dynamic picture of the clotting process by measuring the strength, speed, and quality of clot formation.
- The most commonly used VETs are TEG (Haemonetics Corporation, Braintree, MA) and ROTEM (Instrumentation Laboratory, Bedford, MA).
- A small sample of blood is placed in a special container containing a rotating pin or cup. In TEG, a cylindrical cup with the blood sample rotates around the pin in an arc of 4.758 every 5 seconds. In the latest iteration of TEG (TEG 6s), the cup vibrates at a range of frequencies. In ROTEM, the cup is fixed, while the pin rotates within the cup.
- As the blood clots, the movement of the pin or cup is recorded by a sensor, producing a graphical representation of the clotting process.
- These values provide information on several key parameters, including clotting time (the time it takes for the initial clot to form), clot strength (the maximum strength of the clot), and fibrinolysis (the breakdown of the clot over time).
- VET can be used in the perioperative setting to guide transfusion decisions.
- Newer tests such as ClotPro and the Quantra hemostasis analyzer (HemoSonics, Charlottesville, VA) as well as many others, are potential improvements in VET.7 The newer VET will not be discussed in detail in this summary as they are beyond the scope of a concise review of this technology. However, all of these tests are relatively similar in their clinical utility and application.
TEG/ROTEM Advantages
- There are numerous advantages of TEG/ROTEM as they often provide a more sophisticated understanding of the coagulation process:
- Unlike traditional coagulation tests, such as PT/INR and aPTT (discussed in another summary Link), which provide a static snapshot of clotting ability, TEG/ROTEM provides a dynamic picture of the clotting process and potential abnormalities.
- VETs may detect and quantify the underlying cause of coagulopathy, thus allowing a more targeted administration of specific factor concentrates. By providing a real-time assessment, VETs can help identify patients who are at high risk for bleeding or thrombosis and guide the administration of blood products.3
- Traditional coagulation tests are neither designed to predict bleeding in critically ill patients nor to guide transfusion therapy because they are limited by a lack of real-time monitoring (at least 45 to 60 min or even longer). Conversely, VETs can be performed at the bedside or in the operating room, and rapidly provide numerical and graphical information of patient’s hemostatic situation.8-10
- The use of VETs has been demonstrated to limit the need for blood product transfusion in some clinical settings, such as cardiac surgery, liver surgery, trauma, and burns.7-9
- Rapid TEG can be completed within 15 minutes, allowing a near real-time and quick assessment of a patient’s clotting ability.7-9
TEG/ROTEM Disadvantages
- While ROTEM and TEG are valuable tools for assessing coagulation status in clinical and surgical situations, they do have some limitations and disadvantages:
- The interpretation of ROTEM and TEG results can be complex and requires expertise. Healthcare professionals need to be familiar with the specific parameters and patterns associated with various coagulation abnormalities.
- Reference ranges for ROTEM and TEG parameters can vary between different devices and laboratories. This variability can make it challenging to establish universal standards, and clinicians need to be aware of the specific reference ranges used in their institution.
- There is a lack of standardized testing protocols and reagents across different institutions, which may contribute to variations in results. This makes it important to interpret ROTEM and TEG results within the context of local practices.
- While ROTEM and TEG provide information on overall clot formation, they may have limitations in assessing specific platelet function abnormalities. Additional tests may be required for a more detailed evaluation of platelet dysfunction.
- ROTEM and TEG devices can be costly to purchase and maintain. Additionally, they may require specialized training for personnel. These factors can limit their availability in certain healthcare settings.
- The presence of anticoagulants, particularly heparin, can interfere with ROTEM and TEG results. This may require additional steps or corrections to accurately interpret the coagulation profile in patients receiving anticoagulant therapy.
- ROTEM and TEG provide a global assessment of coagulation but may not always identify specific underlying etiologies of coagulopathy. Additional diagnostic tests may be needed for a more detailed investigation.
- Despite these limitations, ROTEM and TEG remain valuable tools in managing coagulation disorders in various clinical and surgical settings. The disadvantages highlight the importance of using these tests judiciously, alongside clinical judgment and other laboratory results, to make informed treatment decisions.
TEG Interpretation
The TEG graph typically displays several key parameters, including R-time, K-time, Alpha-angle, MA, and LY30.1,2
- R-Time: The R-time represents the time (in minutes) taken for clot initiation and reflects the time taken for clot formation to begin. It is an indicator of the clotting time.
- K-Time: The K-time reflects the rate of clot formation and represents the time (in minutes) it takes for the clot to reach a certain level of firmness. It measures the speed of clot formation after initial fibrin formation and is also an indicator of the clotting time.
- Alpha-angle: The Alpha-angle represents the speed of fibrin formation and cross-linking, which contributes to clot strength. The angle is calculated between the baseline and the point where the TEG tracing reaches a clot amplitude of 20mm. A steeper alpha angle indicates faster clot formation and stronger clot strength.
- Maximum amplitude (MA): The MA represents the maximum strength of the clot and reflects the combined contribution of platelets, fibrinogen, and other clotting factors. It is an important parameter as it indicates the maximum clot strength, and a lower value may suggest a bleeding tendency.
- LY30: LY30 represents the percentage of clot lysis that occurs 30 minutes after MA. It is an indicator of fibrinolysis or the breakdown of the clot. Higher LY30 values indicate greater fibrinolysis and may suggest a higher risk of bleeding.

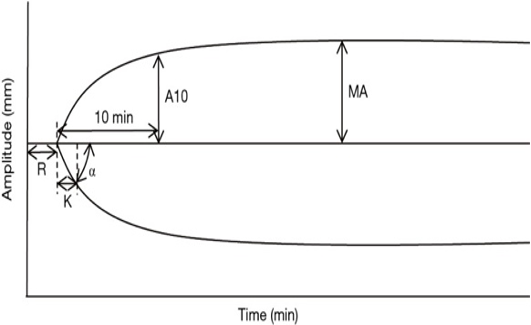
Figure 1. Schematic representation of TEG; Source: Wikimedia Commons
ROTEM Interpretation
The ROTEM graph displays similar parameters, including the CT, CFT, alpha, A10, MCF, LI 30 and ML as defined below.
- Clotting time (CT): CT is the time from the initiation of the ROTEM test until the clot amplitude reaches a predefined level, signifying the duration required for the blood to begin coagulating and forming the initial stages of a clot.
- Clotting formation time (CFT): CFT is the time interval from the end of CT to the point when the ROTEM tracing achieves a specific amplitude, representing the duration for the clot to develop further and reach a stable state. CFT provides insights into the kinetics of clot formation and strengthening.
- Alpha angle: Alpha angle indicates the speed at which fibrin builds up and cross-links, offering information on the initiation and early strengthening phases of clot formation.
- Amplitude at 10 minutes (A10): A10 is a parameter that signifies the strength or firmness of the clot 10 minutes after the initiation of coagulation, reflecting the stability and amplitude of the formed clot
- Maximum clot firmness (MCF): MCF is the highest amplitude or strength reached by the clot, indicating the peak strength and stability of the clot.
- Lysis index at 30 minutes (LI 30): LI30 quantifies the extent of clot breakdown or lysis 30 minutes after the clot’s maximum strength, providing insights into fibrinolysis.
- Maximum lysis (ML): ML is the maximum percentage of clot breakdown observed during fibrinolysis in ROTEM, assessing the susceptibility of the clot to dissolution.
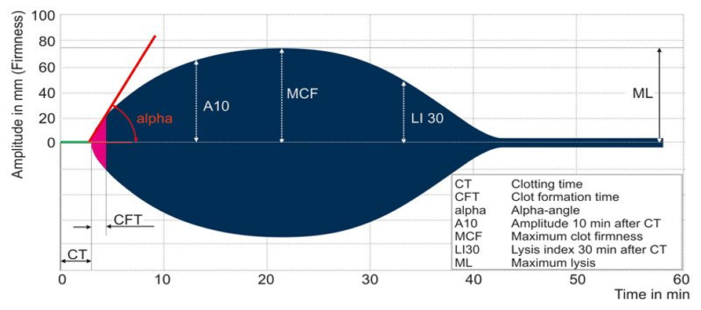
Figure 2. Schematic representation of ROTEM; Image by unknown author is licensed under CC BY-SA-NC Link
- While TEG and ROTEM use different methods and terminology, they generate similar information about clot initiation, formation, stability, and degeneration (Table 1).
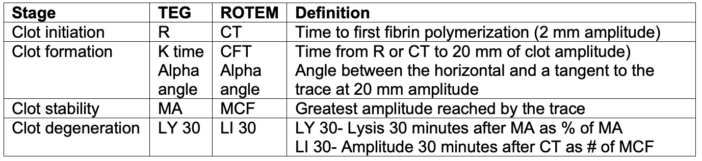
Table 1. Summary of TEG and ROTEM interpretation. Adapted from Smith NW, Pritchett C. Point-of-care coagulation testing: Viscoelastic haemostatic assays. Anaesthesia Tutorial of the Week. WFSAhq.org. Link
Clinical Examples of VET Utility
The examples listed below highlight the utility of ROTEM and TEG in guiding specific treatment decisions based on the nature of the coagulation abnormality detected. Interpretation should be done in conjunction with the overall clinical context, patient history, and other laboratory findings.
Hypocoagulable State/Clotting Factor Deficiency
ROTEM/TEG abnormality: Prolonged clotting time (CT or R time), decreased maximum clot firmness (MCF or MA), and reduced alpha angle may indicate a hypocoagulable state, suggesting a deficiency in clot formation or strength (Figure 3).

Figure 3. Hypocoagulable state. Source: Wikipedia. Mikael Häggström, MD
Treatment: In this scenario, administration of clotting factors, such as fresh frozen plasma (FFP) or specific coagulation factors (e.g., fibrinogen concentrate), may be considered to improve clotting dynamics and enhance hemostasis.
Hypercoagulable State
ROTEM/TEG abnormality: Shortened clotting time, increased MCF or MA, and an elevated alpha angle may suggest a hypercoagulable state or excessive clot formation (Figure 4).

Figure 4. Hypercoagulable state. Source: Wikipedia. Mikael Häggström, MD
Treatment: Anticoagulant therapy or adjustments to existing anticoagulant medications may be necessary to prevent thrombotic events. Monitoring and adjusting doses of anticoagulants, such as heparin or other anticoagulants, can be guided by these tests.
Fibrinolysis
ROTEM/TEG Abnormality: Normal CT or R time, continuous decrease in MA, and increased lysis index or LY30 may indicate enhanced fibrinolysis, suggesting excessive breakdown of clots (Figure 5).

Figure 5. Fibrinolysis. Source: Wikipedia. Mikael Häggström, MD
Treatment: Antifibrinolytic agents like tranexamic acid may be administered to inhibit fibrinolysis and stabilize the clot. This is particularly relevant in surgical settings to reduce bleeding.
Platelet Dysfunction
ROTEM/TEG abnormality: A decreased contribution of platelets to clot formation, as indicated by reduced MCF or impaired platelet component (e.g., G-value in ROTEM), may suggest platelet dysfunction (Figure 6).

Figure 6. Low platelets/platelet dysfunction. Source: Wikipedia. Mikael Häggström, MD
Treatment: Platelet transfusions or medications that enhance platelet function (e.g., desmopressin) may be considered to address platelet-related abnormalities.
Heparin Reversal
ROTEM/TEG abnormality: Prolonged clotting times despite administration of heparin may indicate the need for heparin reversal.
Treatment: Protamine sulfate, a heparin reversal agent, can be administered based on the ROTEM/TEG results to neutralize the anticoagulant effects of heparin.
References
- Shen L, Tabaie S, Ivascu N. Viscoelastic testing inside and beyond the operating room. J Thorac Dis. 2017;9(Suppl 4): S299-S308. PubMed
- Curry NS, Davenport R, Pavord S, et al. The use of viscoelastic haemostatic assays in the management of major bleeding: A British Society for Haematology guideline. Br J Haematol. 2018;182(5):789-806. PubMed
- Mallett SV. Clinical utility of viscoelastic tests of coagulation (TEG/ROTEM) in patients with liver disease and during liver transplantation. Semin Thromb Hemost. 2015; 41:527–37. PubMed
- Aceto P, Punzo G, Di Franco V, et al. Viscoelastic versus conventional coagulation tests to reduce blood product transfusion in patients undergoing liver transplantation: A systematic review and meta-analysis. Eur J Anaesthesiol. 2023;40(1):39-53. PubMed
- Coakley M, Reddy K, Mackie I, et al. Transfusion triggers in orthotopic liver transplantation: a comparison of the thromboelastometry analyzer, the thromboelastogram, and conventional coagulation tests. J Cardiothorac Vasc Anesth. 2006;20(4):548-53. PubMed
- Nielsen VG. A comparison of the thrombelastograph and the ROTEM. Blood Coagul Fibrinolysis. 2007;18(3):247-52. PubMed
- Erdoes G, Koster A, Levy JH. Viscoelastic coagulation testing: Use and current limitations in perioperative decision-making. Anesthesiology. 2021;135(2):342-9. PubMed
- Meco M, Montisci A, Giustiniano E, et al. Viscoelastic blood tests use in adult cardiac surgery: meta-analysis, meta-regression, and trial sequential analysis. J Cardiothorac Vasc Anesth. 2020; 34:119–127. PubMed
- Veigas PV, Callum J, Rizoli S, et al. A systematic review on the rotational thrombelastometry (ROTEM1) values for the diagnosis of coagulopathy, prediction and guidance of blood transfusion and prediction of mortality in trauma patients. Scand J Trauma Resusc Emerg Med. 2016; 24:114. PubMed
- Marsden NJ, Van M, Dean S, et al. Measuring coagulation in burns: an evidence-based systematic review. Scars Burn Heal. 2017; 3:2059513117728201. PubMed
Copyright Information

This work is licensed under a Creative Commons Attribution-NonCommercial-NoDerivatives 4.0 International License.