Key Points
- Power is the probability that the study will correctly reject the null hypothesis.
- When the predicted clinical difference (effect size) between interventions is small, a large sample size is required to have sufficient power.
- Power analysis is performed to determine the sample size needed to give a study sufficient power. It is ideally performed before a study begins and considers the desired power, the threshold for significance, and the effect size of the interventions being studied.
Background
Understanding the following biostatistics concepts will aid greatly in understanding power analysis.
Hypothesis Testing
- Hypothesis testing is a paradigm in statistical evaluation that involves testing a hypothesis regarding the true effect of an intervention.1
- We typically test a pair of hypotheses called the null hypothesis and the alternative hypothesis.2
- The null hypothesis states that there is no difference in outcomes between the groups being studied. For example, drug A and drug B will not cause different results regarding 30-day mortality.
- The alternative hypothesis states that there is indeed a difference.
- The purpose of a study is to provide data that can be used to either confirm the null hypothesis or reject it in favor of the alternative hypothesis.
Population Parameters vs. Estimated Population Parameters
- In statistics, the term “population” refers to the entire group for which you want to draw a conclusion. For example, all postcardiothoracic surgery patients in the United States.
- Each population has specific values (parameters) which describe the characteristics of all the individuals in the population. These parameters are often quantified with calculations like mean and standard deviation. Because these parameters describe the population, we call them population parameters.
- In most cases, we do not know the population parameters. It would be very time-consuming and very costly to gather data from all postcardiothoracic surgery patients in the United States.
- Instead, we estimate these population parameters using a sample of the population.
- In biostatistics, a sample refers to a small representation of the population that contains characteristics of that population (Figure 1).

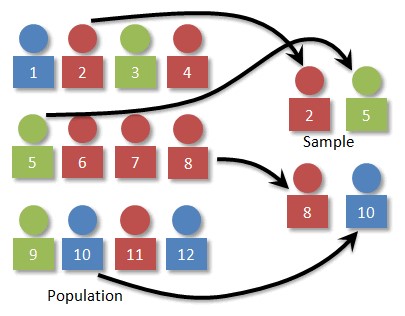
Figure 1. Relationship between population and sample. Source: Simple Random Sampling. Prof. Dan Kernler for Mth 120 Statistics I at Elgin Community College. Link CC-BY-NC-SA.
- Sample size refers to the number of individuals used to estimate the population parameters.
- Studies are designed to include a certain sample size. We reason that this sample size will provide sample parameters which represent the population parameters.
- The larger the sample size, the more closely the sample parameters reflect the population parameters.
What is Power?
- Power is the probability that we will correctly reject the null hypothesis. Said differently, it is the probability of detecting an effect when it is present.2
- Power is an inherent property of a study. We use phrases like, “What is the power of this study?” or “Does this study have enough power?”
- The concept of power is represented by the equation: 1-β.
- β (also referred to as Type II error) is the probability that our study results will conclude that the null hypothesis is correct, when in reality, it is not correct. In other words, our study will conclude that there is no difference between the groups when there is a difference (Figure 2).
- α (also referred to as Type I error) is the probability that our study results will conclude that the null hypothesis is not correct, when in reality, it is correct (Figure 2).
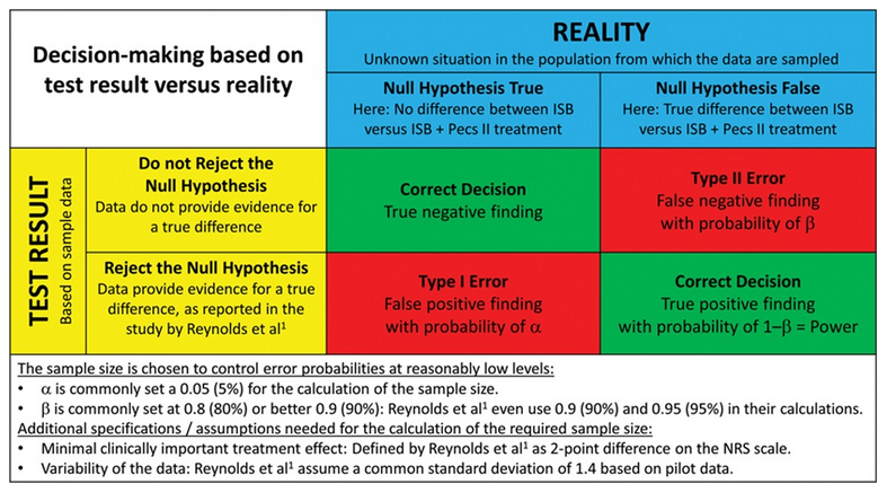
Figure 2. Statistical test result based on study sample data versus the true situation in the population. Reproduced with permission from Schober P, Vetter TR. Sample Size and Power in Clinical Research. Anesth Analg. 2019;129(2):323.2
- Since power is a probability, it is represented by a number between 0 and 1.
- Power of 0.8 means we have an 80% chance of correctly rejecting the null hypothesis.
- The following are some of the several factors that affect power:3
- The precision and variance of measurements within any sample
- The magnitude of a clinically significant difference
- How important it is that the study avoids a Type I or Type II error
- The type of statistical test used
Power Analysis
- Power analysis is used to determine what sample size will ensure sufficient power.
- Power analysis should be conducted during the design of a study.
- Steps in conducting a power analysis for a study include:
- Determine the amount of power desired
- Study authors can choose any value between 0 and 1 as the desired power.
- A commonly chosen value is 0.8, representing an 80% probability that we will correctly reject the null hypothesis.
2. Determine the threshold for significance, also referred to as the p-value
- Study authors can choose any value between 0 and 1 as the desired threshold for significance.
- A commonly chosen value is 0.05, representing a 5% probability that the results derived from the study were due to random chance, not an actual difference in outcome between the groups.
3. Predict the magnitude of clinically significant difference that we want the study to evaluate3
- This clinical difference, also known as effect size, can be represented graphically by the predicted overlap of value distributions for each group (Figure 3).
- Very little overlap between the distribution of values indicates a large effect size.
- A large amount of overlap indicates a small effect size.
- Predicting the effect size can be difficult and often requires estimation using prior data, a literature search, or in a worst-case scenario, an educated guess.
4. Once the desired power, threshold for significance, and predicted effect size have been determined, these values can be used to calculate the required sample size.
- The method for calculating this sample size is beyond the scope of this summary. Online calculators or statistical software packages are commonly used.
5. If the study reaches the calculated sample size, the power of the study will be sufficient, and there is a high probability that the study will correctly reject the null hypothesis.
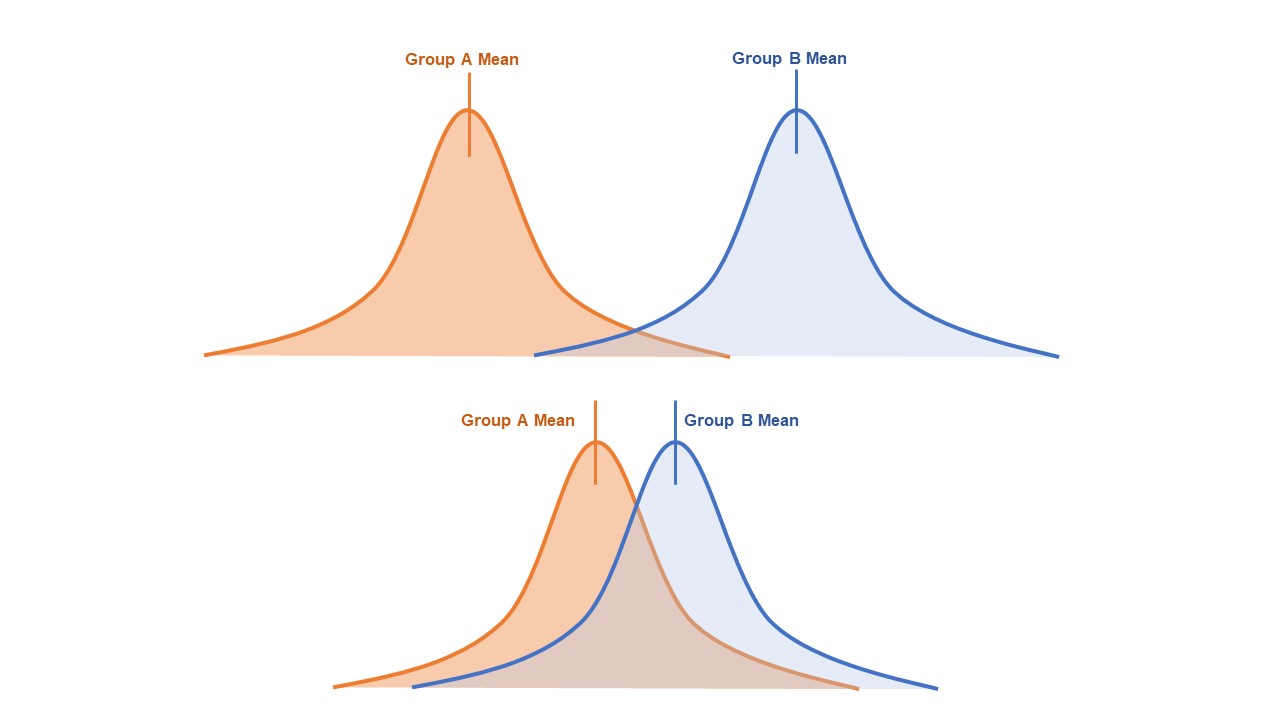
Figure 3. Overlap of distribution of values for two groups. Top: little overlap, large effect size, smaller sample size required to achieve desired power. Bottom: large amount of overlap, small effect size, larger sample size required to achieve the desired power.
References
- Guyatt G, Jaeschke R, Heddle N, et al. Basic statistics for clinicians: 1. Hypothesis testing. CMAJ. 1995;152(1):27-32. PubMed
- Schober P, Vetter TR. Sample Size and Power in Clinical Research. Anesth Analg. 2019;129(2):323. PubMed
- Jones SR, Carley S, Harrison M. An introduction to power and sample size estimation [published correction appears in Emerg Med J. 2004 Jan;21(1):126]. Emerg Med J. 2003;20(5):453-8. PubMed
Copyright Information

This work is licensed under a Creative Commons Attribution-NonCommercial-NoDerivatives 4.0 International License.