Key Points
- The oxygen cascade is described as a progressive decrease in oxygen pressure from the atmosphere to the mitochondria, facilitating oxygen transport and utilization.
- The alveolar-arterial gradient reflects the efficiency of oxygen transfer from alveoli to blood.
- Oxygen is primarily transported by hemoglobin, which can be plotted using the oxygen dissociation curve.
- Oxygen consumption becomes supply-dependent when delivery drops below a critical threshold, leading to anaerobic metabolism.
Introduction
- Oxygen is required for aerobic respiration and energy production in cells.1
- Oxygen acts as the terminal electron acceptor in the mitochondrial electron transport chain, enabling the production of adenosine triphosphate (ATP) through oxidative phosphorylation.1
- Atmospheric air contains 21% oxygen.2,3
- At sea level, the total atmospheric pressure is 760 mmHg, with a partial pressure of oxygen (PO2) of 160 mmHg.1,2
The Oxygen Cascade
- The oxygen cascade describes the flow of oxygen from areas with high PO2 to areas of lower PO2 (Figure 1).1
- Physiologically, this represents the progressive reduction in PO2 from the atmosphere to the alveoli, arterial blood, peripheral tissues, and finally to the mitochondria.1
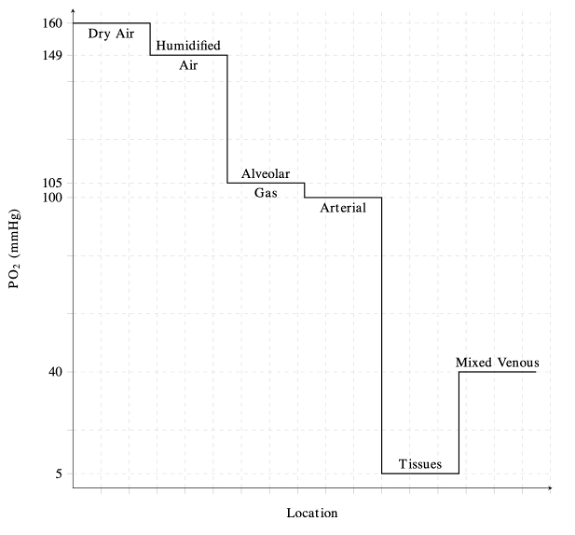
- In the lungs, PO2 decreases from 160 mmHg in atmospheric air to approximately 100 mmHg in the alveoli.1,2
- Air is humidified as it reaches the trachea, and the pressure of inspired oxygen (PiO2) is lowered to approximately 150 mmHg due to the effects of water vapor pressure.1
- The decrease in pressure at the alveoli is influenced by dilution of oxygen with expired CO2.2
- PO2 is lowest at the level of the mitochondria, with pressures ranging from 3.8 to 22.5 mmHg depending on the tissue.1
- Alveolar Gas Equation: Alveolar oxygen pressure (PAO2) is calculated using the alveolar gas equation.

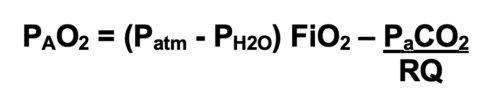
- At sea level, the atmospheric pressure is 760 mmHg, and the vapor pressure of water at body temperature is 47 mmHg.
- The respiratory quotient (RQ) represents the ratio of CO2 production to O2 consumption and is typically set at 0.8.2
- For example, breathing room at sea level would result in a PAO2 of (760-47) 0.21- 40/0.8 or 99.7 mmHg, whereas breathing 100% oxygen at sea level will result in a PAO2 of (760-47) 1- 40/0.8 or 663 mmHg.
- With increasing altitude, the atmospheric pressure decreases, and as a result, PAO2 decreases. Breathing 100% oxygen at the top of Mount Everest (atmospheric pressure of 263 mmHg) will result in a PAO2 of (263-47)1.0- 40/0.8 or 166 mmHg.
The Alveolar-Arterial Gradient
- The alveolar-arterial (A-a) gradient measures the difference between the partial pressure of oxygen in the alveoli (PAO2) and the partial pressure of oxygen in the arterial blood (PaO2).1-3
- The A-a gradient indicates the efficiency of oxygen transfer from the alveoli to the bloodstream.1-3
- A normal A-a gradient is less than 15 mmHg but can increase with aging and respiratory pathology.2
- The etiology of arterial hypoxemia can be classified based on the A-a gradient.3
- Alveolar hypoventilation is a common cause of hypoxemia with a normal A-a gradient.3
- Abnormal diffusion capacity and ventilation-perfusion (V/Q) mismatch represent common causes of hypoxemia with an elevated A-a gradient.3
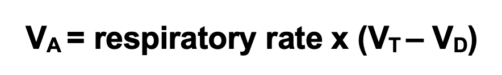
- Alveolar ventilation (VA) is determined by the respiratory rate, the tidal volume (VT), and dead space (VD), and is shown by the equation:2,3
- Alveolar hypoventilation is evident by a decrease in PAO2 and PaO2 with an increase in PaCO2.3
- Alveolar hypoventilation can be caused by respiration depression from sedation, respiratory muscle weakness, and obstructive airway disease.3
- The ventilation/perfusion (V/Q) ratio evaluates lung function by comparing the amount of air reaching the alveoli (ventilation) to the amount of blood reaching the alveoli (perfusion).2,3
- Intrapulmonary shunting, indicated by a low V/Q ratio, decreases PaO2 because blood bypasses ventilated alveoli and returns to the heart unoxygenated; common causes include atelectasis and pneumonia.2,3
- Physiologic dead space, indicated by a high V/Q ratio, decreases PaO2 due to inadequate blood flow to ventilated alveoli, which impairs oxygen transfer into the bloodstream; common causes include pulmonary embolism and emphysema.2,3
- Diffusing capacity (DLO2) indicates the efficiency of oxygen transfer across the alveolar-capillary membrane.2
- Diffusing capacity is measured by the carbon monoxide diffusion capacity (DLCO), with reductions in DLCO indicating poor gas transfer across the alveolar-capillary membrane. It can be seen in extensive alveolar destruction.2
Oxygen Transport in Blood
- Oxygen is carried in the blood in two forms: reversibly bound to hemoglobin and dissolved in plasma.1-3
- Most oxygen is carried by hemoglobin, with less than 2% dissolved in the plasma.3
- Hemoglobin is the oxygen-carrying molecule found in red blood cells.
- Hemoglobin has a quaternary structure made up of four heme groups and four protein subunits, with each heme group containing divalent iron (Fe²⁺) that binds oxygen (Figure 2).1,2
- Each hemoglobin molecule can carry up to four oxygen molecules, with each gram of hemoglobin theoretically transporting up to 1.39 mL of oxygen.1,2
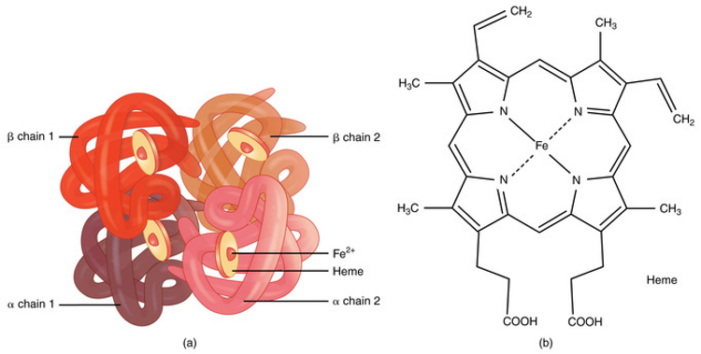
Figure 2. (a) A molecule of hemoglobin. (b) Chemical structure of hemoglobin. Source: bccampus.ca. CC BY. Link
- The oxygen–hemoglobin dissociation curve (or oxygen dissociation curve) plots the percentage of hemoglobin saturation at different oxygen tensions, illustrating how blood carries and releases oxygen (Figure 3).1,2
- Hemoglobin exhibits cooperative binding, where the binding of the first oxygen molecule induces a conformational change, increasing the affinity for additional oxygen molecules. This cooperative binding is evident in the sigmoidal shape of the dissociation curve.1,2
- The steep portion of the curve, between 25% and 100% saturation, shows accelerated oxygen binding secondary to cooperative binding, with PO2 values of 20–40 mmHg facilitating the most efficient oxygen release to tissues.1,2
- As hemoglobin nears 90% saturation, fewer available binding sites cause the curve to flatten until full saturation is reached.2
- The P50 value is the PO2 at which hemoglobin is 50% saturated with oxygen. In a normal adult, the P50 is 26.6 mmHg at 37°C and a pH of 7.4.1,2
- Fetal hemoglobin has a P50 of 18-19 mmHg due to a higher affinity for oxygen, leading to a low P50 in neonates.4 As fetal hemoglobin decreases, P50 increases to about 30 mmHg around ten months of age. It then gradually decreases to adult levels by adolescence.
- A right shift in the curve (increased P50) enhances oxygen release to tissues, while a left shift (decreased P50) reduces oxygen release.1,2
- Hydrogen ion concentration (Bohr effect), CO2 pressure (Haldane effect), temperature, and 2,3-diphosphoglycerate (2,3-DPG) concentration all influence oxygen binding to hemoglobin and can shift the oxygen dissociation curve (Table 1).1,2
- 2,3-DPG is a byproduct of anaerobic metabolism and an allosteric effector of hemoglobin. Increased concentration of 2,3-DPG is commonly seen as a physiological adaptation in chronic anemia.2
- The Bohr effect describes how CO2 and hydrogen ions affect hemoglobin’s affinity for oxygen. The higher CO2 content of venous capillary blood decreases hemoglobin’s affinity for oxygen, facilitating oxygen’s release to the tissues. Conversely, lower CO2 in alveolar capillaries increases hemoglobin’s affinity for oxygen, facilitating oxygen uptake in the alveoli.2
- The Haldane effect describes oxygen’s ability to influence hemoglobin’s affinity for CO2 and hydrogen ions. Deoxygenated hemoglobin has a higher affinity for CO2, whereas oxygenated hemoglobin has a lower affinity for CO2. This effect promotes the release of CO2 from the tissues to the blood and from the blood to the lungs.
- Together, these effects maximize oxygen delivery and CO2 uptake.
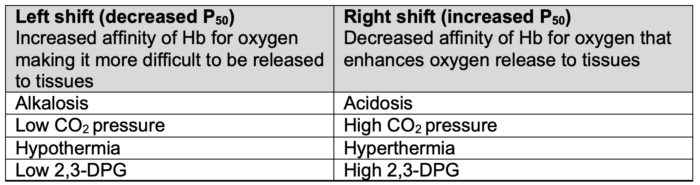
Table 1. Factors impacting the oxygen dissociation curve. Adapted from Habler OP, Messmer KF. The physiology of oxygen transport. Transfus Sci.1997;18(3):425-35.
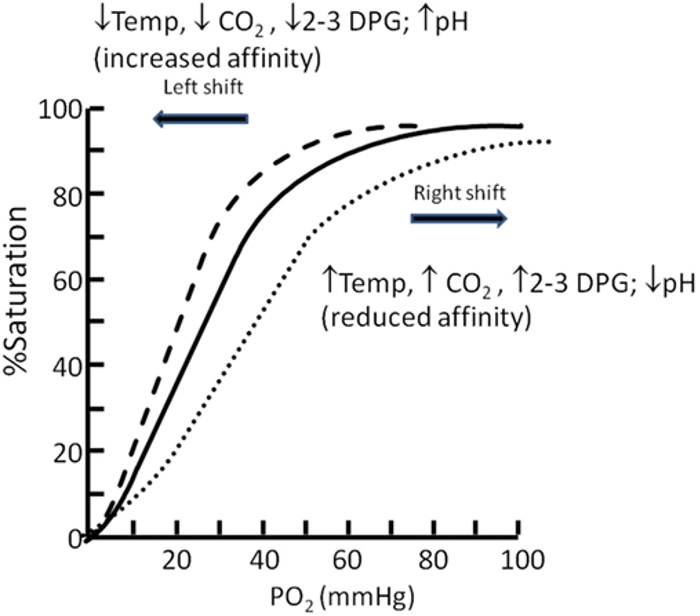
Figure 3. Oxygen dissociation curve. Source: Langley R, Cunningham S. Front Pediatr. 2017. CC BY. Link
- CADET face right is a popular mnemonic for remembering the factors that affect the oxygen-hemoglobin dissociation curve.
- C – CO2
- A – acidosis
- D – 2,3-DPG
- E – exercise
- T – temperature
- Therefore, hypercarbia, acidosis, increased 2,3 DPG, exercise, and hyperthermia cause the oxygen-hemoglobin dissociation curve to shift rightward, making it easier for oxygen to be released to the tissues.
- The concentration of dissolved oxygen in plasma is directly proportional to its partial pressure, resulting in a linear relationship, as described by Henry’s law.1,2
Oxygen Content and Delivery
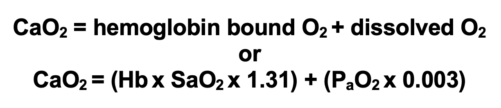
- The oxygen content of arterial blood (CaO₂) is the sum of oxygen dissolved in plasma and bound to hemoglobin. It can be calculated using hemoglobin concentration (Hb) in g/dL, hemoglobin saturation (SaO₂), the oxygen-carrying capacity of hemoglobin (1.31 mL O₂/g), and the solubility of oxygen in plasma (0.003 mL O₂/dL/mmHg), as shown by the equation:1,2
- Oxygen delivery (DO₂) to tissues is calculated as the product of cardiac output (CO) per minute and CaO2, and is represented by the equation:1,2

-
- For a resting adult, a normal DO₂ is approximately 1000 mL O₂/min.1,2
Oxygen Consumption, Extraction, and Physiological Supply
- Oxygen consumption (VO2) is calculated from the product of cardiac output and the difference between arterial oxygen content (CaO2) and venous oxygen content (CvO2). This is represented by the Fick equation:1,2
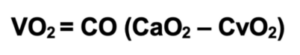
-
- For a resting adult, a normal VO₂ is approximately 250 mL O₂/min. This indicates that only 25% of the delivered oxygen is used, with the remaining 75% serving as a reserve for increased demand.1,2
- Increased oxygen demand (VO₂) is met by a combination of higher cardiac output and enhanced oxygen extraction from the blood.1,3
- Moderate reductions in oxygen delivery generally do not significantly impact oxygen consumption due to compensatory increased oxygen extraction, which lowers mixed venous O₂ saturation. This is known as supply-independent oxygenation.1,3
- Once oxygen delivery decreases below a critical level (DO₂crit), oxygen consumption will decrease because the oxygen supply can no longer meet the tissue’s oxygen demand. This represents supply-dependent oxygenation and leads to reliance on anaerobic metabolism and lactic acidosis.1-3
- Physiologic oxygen stores include the oxygen in the lungs, bound to hemoglobin or in tissues, and dissolved in plasma.2,4
- Oxygen stores are essential during interruptions in supply, such as apnea, as their depletion can result in hypoxemia within about 90 seconds.2
- Ventilation with 100% oxygen substantially increases the oxygen content in the lungs, delaying the onset of hypoxemia during apnea to 4 to 5 minutes. This principle underlies preoxygenation strategies before anesthesia induction (Table 2).2,5
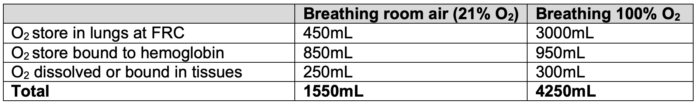
Table 2. Physiologic oxygen stores. FRC = functional residual capacity. Adapted from Law R, Bukwirwa H. The physiology of oxygen delivery. Update in Anesthesia.1999;10:20-23. Link
Mixed Venous Oxygen Saturation
- Mixed venous oxygen saturation (SvO2) reflects the overall balance between oxygen supply and demand by representing the average venous saturation from all organs. SvO2 does not provide information about oxygenation in individual organs.2,3
- A normal SvO2 ranges from 65-75%, indicating a tissue oxygen extraction of 25-35%.3
- Accurate measurement requires sampling from the pulmonary artery via a Swan-Ganz catheter.
- SvO2 can be calculated using a modified form of the Fick equation:2

- SvO2 has diagnostic value in identifying underlying issues with oxygen delivery and consumption (Table 3).2
- A decrease in SvO2 signals that compensatory mechanisms (increased cardiac output or arterial oxygen content) are failing to meet the body’s oxygen demands.2.3
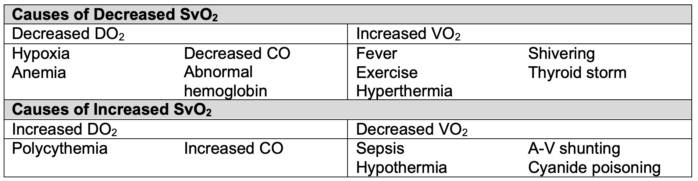
Table 3. Alterations in SvO2.2 CO = cardiac output, A-V = arterio-venous
Oxygen Toxicity
- Oxygen toxicity can occur with either acute or chronic exposure to high oxygen concentrations, potentially leading to cell damage and death.6
- Acute oxygen toxicity primarily affects the central nervous system, with symptoms such as muscle twitching, tinnitus, nausea, and seizures.6
- The risk for acute oxygen toxicity is increased at high oxygen pressures, including hyperbaric oxygen therapy.6
- Pulmonary effects are related to chronic oxygen toxicity.6
- Chronic exposure to oxygen-derived free radicals is believed to damage cell membranes and disrupt protein synthesis, leading to pulmonary edema and fibrosis.6
- The fraction of inspired oxygen (FiO2) can be kept below 0.8 to reduce the risk of oxygen toxicity and the chance of developing pulmonary fibrosis.3
References
- Habler OP, Messmer KF. The physiology of oxygen transport. Transfus Sci. 1997;18(3):425-435. PubMed
- Respiratory physiology & anesthesia. In: Butterworth IV JF, Mackey DC, Wasnick JD. eds. Morgan & Mikhail’s Clinical Anesthesiology, 7e. McGraw-Hill Education; 2022. Accessed September 12, 2024. Link
- Treacher DF, Leach RM. Oxygen transport-1. Basic principles. BMJ.1998;317(7168):1302-6. Link
- Motoyama EK, Finder JD. Respiratory physiology. In: Davis PJ, Cladis FP (eds). Smith’s Anesthesia for Infants and Children. 10e. Elsevier, Philadelphia, PA. 2022; 65-66.
- Law R, Bukwirwa H. The physiology of oxygen delivery. Update in Anesthesia.1999;10:20-23. Link
- Cooper JS, Phuyal P, Shah N. Oxygen toxicity. In: StatPearls (Internet). Treasure Island, FL. StatPearls Publishing; 2024. Accessed September 15, 2024. Link
Other References
- Hemoglobin. Bechtel A, Chiao S. OA Keys to the Cart. 2020. Link
Copyright Information

This work is licensed under a Creative Commons Attribution-NonCommercial-NoDerivatives 4.0 International License.