Key Points
- Quantifying risk and treatment effects is essential in clinical trials and epidemiological studies to evaluate interventions and identify health risks.
- Statistical measures like relative risk (RR), odds ratio (OR), absolute risk reduction (ARR), and attributable risk (AR) allow researchers to compare outcomes between different groups and interpret the impact of exposures.
- These tools are critical for shaping clinical guidelines and informing public health policies, providing insight into the effectiveness and safety of medical interventions.
- A clear understanding of these metrics ensures the accurate interpretation of data, which supports better clinical decisions and improves patient outcomes.
Relative Risk
Definition
RR compares the probability of an event occurring in the treatment group to the probability in the control group.1
Formula
RR = Risk in Treatment Group/Risk in Control Group
Interpretation
- RR = 1: No difference between groups.
- RR > 1: Increased risk in the treatment group.
- RR < 1: Decreased risk in the treatment group.
Example
If 10% of patients receiving a new anesthetic agent experience postoperative nausea, compared to 20% with the standard agent, the RR is 0.5, indicating a 50% reduction in risk.
Calculation


Assumptions and Limitations
The validity of RR relies on key assumptions.
- RR requires that the exposures or interventions are independent and do not influence each other.2
- RR works best in studies that track participants over time.1,2
- Therefore, this measure is limited to cohort studies and randomized controlled trials (RCTs) because incidence data are necessary for calculations.1,2
- RR is unsuitable for case-control studies.1,3
- In populations with low event rates, RR may overstate the clinical significance of findings.3
- A 95% confidence interval (CI) around RR reflects the precision of the estimate. If the CI is narrow, the estimate is considered reliable, while a CI crossing 1 indicates no statistically significant difference between groups.1,2
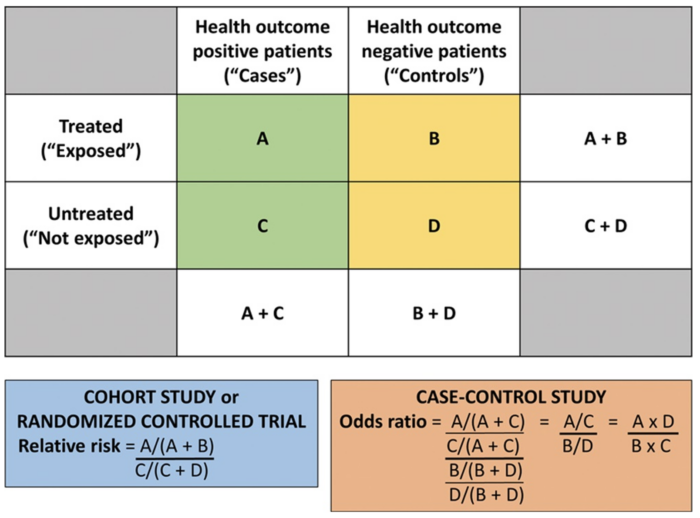
Figure 1. Calculating the RR and OR from a conventional 2 × 2 contingency table. Used with permission from Vetter TR et al. Anesth Analg. 2017.4
Odds Ratio
Definition
OR compares the odds of an event occurring in the treatment group to those in the control group.1
Formula
OR = Odds in Treatment Group/Odds in Control Group
Interpretation
- OR = 1: No difference between groups.
- OR > 1: Increased odds in the treatment group.
- OR < 1: Decreased odds in the treatment group.
Example
In a study, if 30 out of 300 patients in the intubation group experience laryngeal injury, compared to 10 out of 300 in the supraglottic airway group, the OR is approximately 3.22, indicating higher odds of injury with intubation.
Calculation

Assumptions and Limitations
- OR is most appropriate for case-control and retrospective studies where incidence rates are not directly available.1,5
- OR can overestimate risk when the event is common.1,3
- OR approximates RR accurately when the event is rare.1,5
- CIs are crucial for interpreting OR, as a wide CI reflects uncertainty, often due to small sample sizes. If the CI does not cross 1, the OR suggests a statistically significant difference between groups.1,5
Absolute Risk Reduction
Definition
ARR is the absolute difference in event rates between the control and treatment groups.1
Formula
ARR = (Risk in Control Group) – (Risk in Treatment Group)
Interpretation
ARR quantifies the actual decrease in risk provided by the treatment.1
One of the most critical applications of ARR is calculating the number needed to treat (NNT) and number needed to harm (NNH).
NNT indicates how many patients must receive the intervention to prevent one additional adverse event.1 This measure offers a straightforward way to express treatment effectiveness in patient terms.1
- Formula: 1/ARR
- Clinical Relevance: A lower NNT signifies a more effective treatment, while higher values suggest modest benefits.1
NNH indicates how many patients need to be treated for one additional patient to experience an adverse effect.4
- Formula: 1/(Absolute Risk Increase)
- Clinical Relevance: A higher NNH signifies that harm is less frequent, implying better safety.4
Example
If a nerve block reduces the incidence of chronic postsurgical pain from 15% to 5%, the ARR is 10%, meaning there’s a 10% absolute reduction in risk. The number needed to treat is 10, meaning that 10 patients must receive the intervention to prevent one case of chronic postsurgical pain.
In this example, if the risk for nerve injury increases from 1% to 5%, the Absolute Risk Increase (ARI) would be 4%. Therefore, the number needed to harm is 25, meaning that for every 25 patients who receive the nerve block, one additional patient will experience a nerve injury.
Calculation

Assumptions and Limitations
- ARR assumes the baseline risk does not change between groups.6
- This measure is highly sensitive to sample size, i.e., smaller studies may produce wide variability in ARR estimates.7
- A narrow CI around ARR reflects greater precision and confidence in the result, while a wide CI suggests uncertainty.6
Attributable Risk
Definition
AR, also known as risk difference, measures the difference in risk between exposed and unexposed groups.8
Formula
AR = (Risk in Exposed Group) – (Risk in Unexposed Group)
Interpretation
AR indicates the proportion of incidents in the exposed group that can be attributed to the exposure.8
Example
If the incidence of perioperative respiratory complications is 8% in smokers and 2% in nonsmokers, the AR is 6%, suggesting that smoking accounts for a 6% increase in complications. The AR percentage is 75%, meaning that 75% of complications in smokers can be attributed to smoking.
Calculation

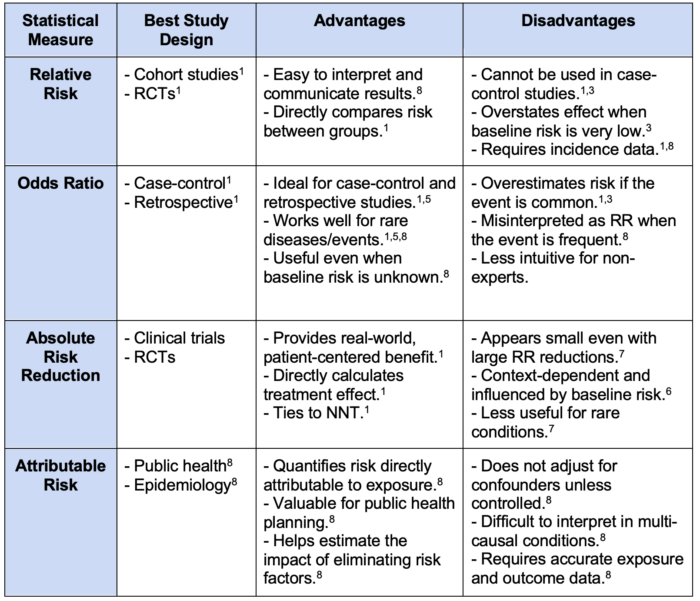
Table 1. Comparative analysis of relative risk, odds ratio, absolute risk reduction, and attributable risk. Abbreviations: RCTs, randomized controlled trials; RR, relative risk; NNT, number needed to treat.
References
- Monaghan TF, Rahman SN, Agudelo CW, et al. Foundational statistical principles in medical research: A tutorial on odds ratios, relative risk, absolute risk, and number needed to treat. Int J Environ Res Public Health. 2021;18(11):5669. PubMed
- Sørensen HT, Lash TL, Rothman KJ. Beyond randomized controlled trials: a critical comparison of trials with nonrandomized studies. Hepatology. 2006;44(5):1075-1082. PubMed
- Doi SA, Furuya-Kanamori L, Xu C, Lin L, Chivese T, Thalib L. Controversy and debate: Questionable utility of the relative risk in clinical research: Paper 1: A call for change to practice. J Clin Epidemiol. 2022; 142:271-9. PubMed
- Vetter TR, Jesser CA. Fundamental epidemiology terminology and measures: It really is all in the name. Anesth Analg. 2017;125(6):2146-51. PubMed
- Pearce N. Analysis of matched case-control studies. BMJ. 2016;352: i969. PubMed
- Van Spall HGC, Averbuch T, Damman K, Voors AA. Risk and risk reduction in trials of heart failure with reduced ejection fraction: absolute or relative? Eur J Heart Fail. 2021;23(9):1437-44. PubMed
- Meder B, Wu CM, Rebitschek FG. Causal analysis of absolute and relative risk reductions. 2024. Link
- Reference Guide on Epidemiology. Federal Judicial Center; 2012. Accessed December 28, 2024. Link
Copyright Information

This work is licensed under a Creative Commons Attribution-NonCommercial-NoDerivatives 4.0 International License.