Key Points
- The mean, median, and mode each have their own strengths and limitations, with the choice of which to use depending on the type of data and the presence of outliers.
- The relationship between mean, median, and mode can be reflected in the shape of distribution curves, with all three measures aligning in normal data but separating in positively and negatively skewed data.
- Sample sizes can affect the reliability of data, with larger samples helping to stabilize the mean and smaller samples making the median a more dependable measure.
Measures of Central Tendency
- The three main measures of central tendency are the mean, median, and mode.1,2
Mean
- The mean is often referred to as the arithmetic average, and it is symbolized as x̄.1
- It is the most widely used measure of central tendency.1,2
- It is calculated by adding all the values in a dataset and dividing the sum by the total number of observations.1,2
- Advantages:
- The mean considers all values in the dataset making it very comprehensive.1
- It is stable across repeated samples from the same population.1
- It is a unique value meaning that there is only one mean for a given dataset, making it useful when comparing different groups.2
- It utilizes every observation in the dataset.2
- Disadvantages:
- It is sensitive to outliers, especially when the dataset is small.1.2
- It cannot be used for categorical or ordinal data.1
- The weighted mean can be used to reduce the effect of outliers:1
- Each value is multiplied by a weight which is based on frequency or importance.1
- Weighted values are summed and divided by the total weights.1
- Outliers have less influence since their weight is small.1
- Example
- During induction of general anesthesia, an anesthesiologist records the heart rate of 5 patients one minute after propofol administration:
- 72, 78, 81, 75, 84 beats per minute
- To calculate the mean heart rate (x̄):
- x̄=(72+78+81+75+84)/5
- x̄=78 bpm
- The mean heart rate for these patients after induction was 78 bpm.
- This provides a single representative value that summarizes the group’s response.
- During induction of general anesthesia, an anesthesiologist records the heart rate of 5 patients one minute after propofol administration:
Median
- The median is the midpoint of a dataset after the values are arranged in order from either ascending or descending value.2
- It divides the dataset into two equal halves, with 50% of values lying below and 50% above it.1
- If the dataset has an odd number of values, the median is the middle observation.1
- If the dataset has an even number of values, it is determined from the average of the middle two observations.1
- Advantages:
- It is easy to calculate and understand.1
- It works with ratio, interval, and ordinal data.1
- It is not affected by extreme values, making it suitable for skewed datasets.2
- Similar to the mean, the median is also a unique value, making it useful for group comparisons.2
- Disadvantages:
- It does not use all values, only the position in the ordered dataset.1
- It cannot be easily used in statistical models.1
- It is less popular than the mean, even though it is often more robust in the presence of outliers.2
- Example
- An anesthesiologist records the time to eye opening after extubating in 7 patients: 6, 8, 7, 12, 9, 15, 10 minutes
- Step 1: Arrange values in ascending order:
- 6, 7, 8, 9, 10, 12, 15
- Step 2: Find the middle value
- Since there are 7 values, the median is the 4th observation.
- Median = 9 minutes
- This means that half the patients woke up in less than 9 minutes, and half took more than 9 minutes.
Mode
- The mode represents the most frequently occurring value within a dataset.1,2
- Datasets can be bimodal or multimodal.1,2
- Advantages:
- It identifies the most frequent value in a dataset.1,2
- It is useful for describing bimodal or multimodal distributions (two or more peaks).1
- It is the only measure that can be used with nominal data.1
- Disadvantages:
- It is strongly influenced by small sample sizes.1
- It is rarely used in advanced statistical analysis.1
- Since multiple modes can exist in a single dataset, it is not reliable for comparing between groups.2
- Example:
- An anesthesiologist measures the time to loss of consciousness after propofol administration in 9 patients: 40, 35, 38, 42, 40, 37, 40, 36, 38 seconds
- Step 1: Count the frequency of each time:
- 35 sec: 1
- 36 sec: 1
- 37 sec: 1
- 38 sec: 2
- 40 sec: 3
- 42 sec: 1
- Step 2: Identify the most frequent value:
- Mode = 40 seconds
- The most common time to loss of consciousness in this group was 40 seconds, making it the mode of the dataset.
Impact of Distribution
- The mean, median, and mode of a dataset reflect the shape of the distribution.1
Normal Distribution
- The bell-shaped normal distribution is the most frequently encountered statistical distribution.3
- Numerous inferential statistical tests rely on the assumption that datasets conform to this distribution.3
- In a normal distribution, the mean, median, and mode all align at the same central point (Figure 1).1-3
Skewed Distribution
- The mean shifts toward the tail of the distribution curve as it is influenced by extreme values.1,2,4
- The mode remains at the peak.1,4
- The median typically falls between the mean and mode.1,4
Positive skew (right-skewed) (Figure 1):
- The tail is longer on the right side.1
- The bulk of values lie to the left of the mean.1
Negative skew (left-skewed) (Figure 1):
- The tail is longer on the left side.1
- The bulk of values lies to the right of the mean.1

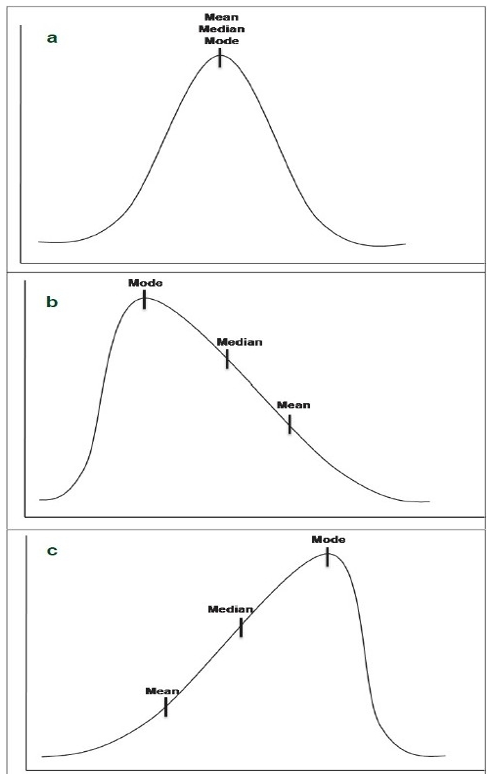
Figure 1. Comparison of the positions of central tendency measures across distributions: (a) Normal, (b) Positively (right) skewed, (c) Negatively (left) skewed. Reproduced from Manikandan S. Measures of central tendency: Median and mode. J Pharmacol Pharmacother. 2011;2(3):214-215.
Sample Size and Central Tendency
- Sample size plays a critical role in how accurate the measures of central tendency are.1,5
- Sample size directly influences variability.1
- Larger sample sizes reduce standard deviation, concentrating more data around the mean.1
- Smaller samples increase standard deviation.1,2
- Small samples also reduce reproducibility, as chance plays a larger role in shaping the distribution.1
- The mean is more affected by variability and outliers when sample sizes are small, making it less reliable.1
- The median is often more stable under these conditions.1
- In clinical research, the choice between mean and median must account for both the data’s shape and the sample size of the study.1
References
- Khorana A, Pareek A, Ollivier M, et al. Choosing the appropriate measure of central tendency: mean, median, or mode? Knee Surg Sports Traumatol Arthrosc. 2023;31(1):12-15. PubMed
- Mishra P, Pandey CM, Singh U, Gupta A, Sahu C, Keshri A. Descriptive statistics and normality tests for statistical data. Ann Card Anaesth. 2019;22(1):67-72. Link
- Vetter TR. Fundamentals of research data and variables: The devil Is in the details. Anesth Analg. 2017;125(4):1375-80. PubMed
- Manikandan S. Measures of central tendency: Median and mode. J Pharmacol Pharmacother. 2011;2(3):214-5. Link
- Krithikadatta J. Normal distribution. J Conserv Dent. 2014;17(1):96-7. Link
Copyright Information

This work is licensed under a Creative Commons Attribution-NonCommercial-NoDerivatives 4.0 International License.