Key Points
- The Kaplan-Meier (KM) method estimates the probability of remaining event-free over time and is widely used in clinical research.
- It accurately incorporates censored data, allowing for the inclusion of participants lost to follow-up or those that are event-free at study completion without biasing survival estimates.
- The stepwise KM curve visually represents survival probabilities and enables comparison between groups, typically analyzed using the log-rank test.
Overview and Fundamentals
- The KM method was introduced in 1958 by Edward Kaplan and Paul Meier and it is a nonparametric estimator used in survival analysis.1-3
- It is used to estimate how long it takes for a specific event to occur.1,2
- It can represent:
- Tumor recurrence/progression1
- Drug response or withdrawal1,2
- It addresses how to handle incomplete follow-up data.1
- It allows for estimation of survival probabilities even when subjects do not experience the event.1-3
- In anesthesiology, KM analysis could be used to study:
- Time to extubation following propofol vs sevoflurane anesthesia
- Time to onset of postoperative nausea and vomiting (PONV)
- The goal is to quantify the probability of remaining event free (i.e., extubation not achieved or no PONV) across a period.
Time-to-Event Data
- An event captures whether and when an event occurs.4
- Each participant contributes a “serial time” variable composed of:
- A start point when the treatment is initiated1,2
- An end point when an event occurs or censoring1,2
- Each participant contributes a “serial time” variable composed of:
- Serial vs calendar time:
- Serial time aligns participants by follow-up duration not by calendar date.1
- This allows meaningful comparison despite staggered enrollment.1
- The KM estimator incorporates all subjects up to their event or censoring time, maintaining accuracy in longitudinal outcome measurement.2
Censoring and the KM Estimator
Censoring
- Occurs when a subject’s total time to an event is not fully observed and it represents incomplete information.2-4
- There are several reasons for censoring:
- Participants are lost to follow-up.1
- Study ends before the event occurs.1
- Subject remains event-free at study completion.1
- On KM curves, censored subjects appear as tick marks.1,3
- Tick marks do not cause downward steps, preserving survival probability integrity.1,3
Types of Censoring
- Right censoring:
- The event has not yet occurred at last observation.2-5
- Type I: Study ends before all the events occur.2,5
- Type II: Study ends once a set number of events have occurred.4,5
- The event has not yet occurred at last observation.2-5
- Left censoring:
- The event occurred before study entry; the subject entered was already at risk.4,5
- Interval censoring:
- The event occurred between two known times, but the exact moment is unknown.4,5
Effect on Analysis
- Censored participants are removed from the risk set for subsequent time intervals.1,2
- If censoring coincides with an event, it is conventionally treated as occurring immediately after the event to avoid underestimation.1
The KM Estimator
- Also called the product limit estimator.2
- Calculates the conditional probability of survival at each observed event time.2
- At each event time, the probability of surviving that interval is:2
- Survival probability = (number living at start – number died) / number living at start2
- Cumulative survival up to any point is obtained by multiplying the survival probabilities of all preceding intervals.2
- The resulting curve is a step function, remaining flat between events and dropping vertically at each event.2-4
- The median survival time corresponds to the point where cumulative survival equals 0.5.1-4

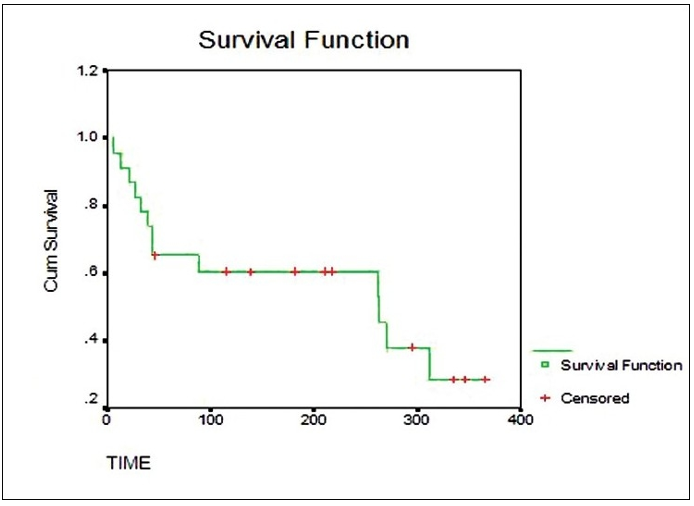
Figure 1. Kaplan-Meier survival curve demonstrating the cumulative survival probability over time. The green stepwise line represents the estimated survival function and the red crosses indicate censored observations. Source: Goel A, et al. Understanding survival analysis: Kaplan-Meier estimate. Int J Ayurveda Res. 2010;1(4):274-8. CC-BY 3.0.
Interpretation, Assumptions, and Clinical Implications
Interpretation of KM Curves
- X-axis represents time1-4,6
- Y-axis represents the proportion of patients who have not experienced the events.1-4,6
- The step-shaped curve reflects event occurrences and censoring.1-4,6
- Horizontal segments represent intervals with no events.1-4,6
- Vertical drop represents one or more events.1-4,6
- Tick marks are censored observations.1,3
- Differences between groups are commonly evaluated using the log-rank test.1-4,6
Assumptions of the KM Method
- Each participant’s outcome is independent of others.4
- Censoring is unrelated to the likelihood of the event.4
- Event risk is consistent for participants regardless of when they enter the study.2,4
- Events can occur at any time therefore, frequent follow-ups improve accuracy.4
- Violating these assumptions can lead to bias and reduced validity.4
Clinical and Research Implications
- Advantages
- It accurately incorporates censored data which allows inclusion of patients that are lost to follow-up or event free at the completion of the study.7
- It is a visually intuitive approach that clearly represents survival probability over time.7
- The method allows straightforward comparison between treatment groups.7
- Disadvantages
- It can overestimate survival probabilities in the presence of competing risks (i.e., deaths from unrelated causes).7
- Missing data can introduce bias and reduce validity of results.3,7
- The reliability of the curve decreases near the end of follow-up when the number of patients at risk becomes small, increasing uncertainty.3,7
- Understanding the assumptions, construction and limitations of KM analysis is essential for valid interpretation of survival data and evidence-based clinical decision-making.
References
- Rich JT, Neely JG, Paniello RC, Voelker CC, Nussenbaum B, Wang EW. A practical guide to understanding Kaplan-Meier curves. Otolaryngol Head Neck Surg. 2010;143(3):331-6. PubMed
- Goel MK, Khanna P, Kishore J. Understanding survival analysis: Kaplan-Meier estimate. Int J Ayurveda Res. 2010;1(4):274-8. PubMed
- Dudley WN, Wickham R, Coombs N. An introduction to survival statistics: Kaplan-Meier analysis. J Adv Pract Oncol. 2016;7(1):91-100. PubMed
- Gomes AP, Costa B, Marques R, Nunes V, Coelho C. Kaplan-Meier survival analysis: practical insights for clinicians. Acta Med Port. 2024;37(4):280-5. PubMed
- Lotspeich SC, Ashner MC, Vazquez JE, et al. Making sense of censored covariates: statistical methods for studies of Huntington's disease. Annu Rev Stat Appl. 2024; 11:255-77. PubMed
- Devlin SM, O’Quigley J. Deconstructing the Kaplan-Meier curve: quantification of treatment effect using the treatment effect process. Contemp Clin Trials. 2023; 125:107043. PubMed
- Bollschweiler E. Benefits and limitations of Kaplan-Meier calculations of survival chance in cancer surgery. Langenbecks Arch Surg. 2003;388(4):239-44. PubMed
Copyright Information

This work is licensed under a Creative Commons Attribution-NonCommercial-NoDerivatives 4.0 International License.