The Doppler effect describes the changes in frequency or wavelength of sound waves as a result of motion between the source and receiver of sound. Classically, this can be recognized as change in the pitch of a horn (sound source) of a moving vehicle as it is moving toward you (sound receiver) versus away from you. Similar principles apply if the roles are reversed (i.e., the receiver is moving toward a constant source). The use of color doppler on ultrasound (US) uses these principles to produce a color-coded map to show movement of objects either toward or away from a source (the transducer). If blood is moving towards the transducer, the frequency of sound returned to the probe will be higher than when the sound was produced. If blood is moving away from the transducer the opposite will occur. The machine then interprets this information into a color-coded map used to indicate flow.
Fast Facts
•Medical US detects at 1-20MHz, whereas the human ear detects sound at 20-20,000 Hz.
•The speed that sound waves can move through a medium depends on the density and resistance of the medium.
•B-mode: aka brightness mode aka 2D mode is the DEFAULT mode to give a linear array of scan images when machine is turned on.
•What determines resistance to flow? Radius, viscosity and length
•Poiseuille’s Law: Flow = pi x pressure x radius4/ (8 x viscosity x Length)
•Doppler frequency changes in sound waves off a moving object.
•US images of flow: a series of pulses gets transmitted to detect blood movement
– Echoes from a stationary object (aka tissue): same from pulse to pulse
-Echoes from movies scatterers exhibits slight differences in time for significant to be returned to receiver
Doppler Frequency: differences in echo expressed as a phase shift
Doppler Sonogram: Doppler frequency which is processed and produce a color flow display
What does Doppler signal depend upon?
1. Blood velocity: increase in velocity will increase Doppler frequency
2. US frequency increases lead to increases in Doppler frequency
3. Choice of frequency: better sensitivity to flow or better penetration
4. Angle of US probe: increased frequency as Doppler US beam becomes more aligned with flow direction
Flow Imaging Modes
1. Color: gives limited information over a large area and is used to identify vessels; red means blood moves towards probe and blue is blood moving away from probe
2. Spectral: looks at flow in just one site to allow calculation of velocity and indices
These are used in complement to each other.
Color Flow Imaging
Puts color flow Doppler shifts onto a superimposed B mode image
Factors affecting:
A. Power: transmitted into tissue
B. Gain: sensitivity to flow signals
C. Frequency: trade off of penetration for sensitivity and resolution
D. Scale (aka pulse repetition): low pulse repetitions frequency looks at low velocities and high pulse repetition frequency
Blood flow calculations
1. Velocity: can be calculated with the Doppler equation if the beam angle is known but can be prone to error
2. Absolute flow: fraught with errors
3. Wave form analysis: look at shape and spectrum to figure out proximal (PAD) and distal disease processes (uterine or fetal changes)

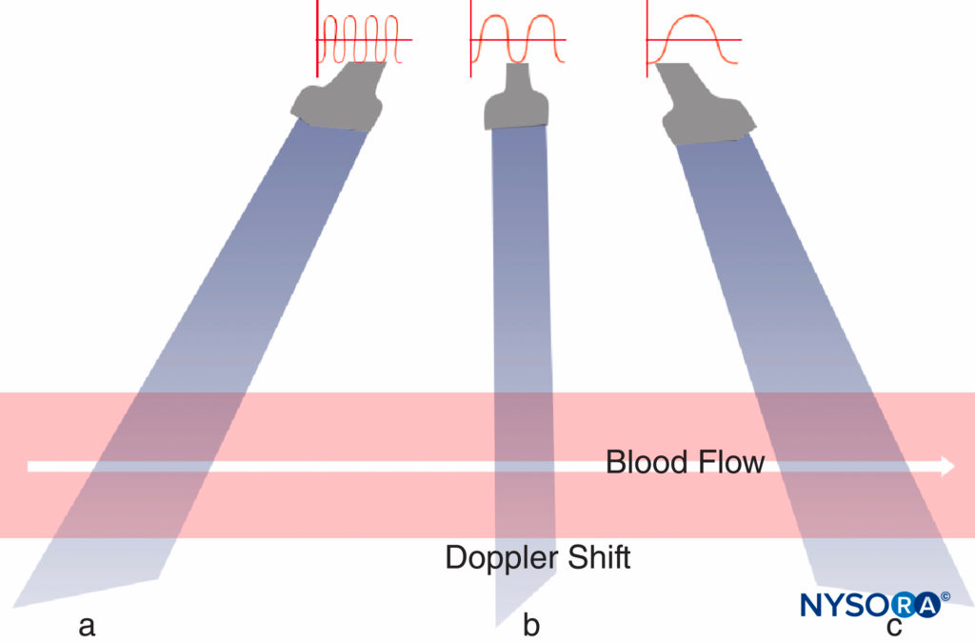
Doppler shift; NYSORA, https://www.nysora.com/
Other References
- Physics of Ultrasound Link
Copyright Information

This work is licensed under a Creative Commons Attribution-NonCommercial-NoDerivatives 4.0 International License.