Key Points
- Central venous pressure (CVP) is a dynamic measurement of right atrial pressure, and its waveform can be analyzed to aid in the diagnosis of a variety of cardiac conditions.
- Pulmonary arterial wedge pressure (PAWP) approximates left ventricular end-diastolic pressure (LVEDP) and is measured via placement of a pulmonary arterial catheter. While the information gleaned from this can be useful, the risks and benefits of placing this invasive monitor in each clinical scenario must be carefully weighed by the anesthesiologist.
Central Venous Pressure Waveforms
- What is it?
- CVP is a dynamic measurement of right atrial pressure (RAP) and is measured through central line access, most commonly via the internal jugular vein (IJV).1
- What can affect it?
- CVP is affected by blood volume status, right ventricular (RV) function, venous tone, and intrathoracic pressure changes. Additionally, several pathologies can skew CVP and its corresponding waveform (see Figure 1):1,2
- Atrial fibrillation
- Atrial ventricular nodal dissociation
- Severe tricuspid stenosis and regurgitation
- RV failure and ischemic events
- Cardiac tamponade
- Pericardial constriction
- CVP is affected by blood volume status, right ventricular (RV) function, venous tone, and intrathoracic pressure changes. Additionally, several pathologies can skew CVP and its corresponding waveform (see Figure 1):1,2

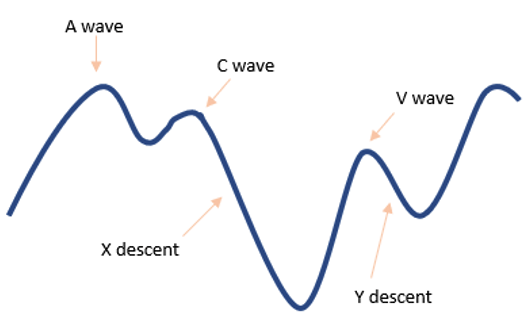
Figure 1. CVP waveform
- A-wave
- Represents atrial contraction
- Occurs at the same time as the P wave on an electrocardiogram (ECG)
- A-waves are absent in atrial fibrillation.
- Large A waves occur with resistance to emptying of right atrium (RA): tricuspid stenosis, right ventricular hypertrophy, acute or chronic lung disease associated with pulmonary hypertension, impaired RV compliance, etc.
- C-wave
- Represents tricuspid valve closing and bulging into the right atrium during isovolumetric RV contraction
- Occurs at the same time as the QRS complex on ECG
- X-descent
- Represents RA relaxation during RV contraction
- V-wave
- Represents atrial filling against a closed tricuspid valve
- Occurs immediately following the T wave on ECG
- Large V waves occur in tricuspid regurgitation, RV ischemia or failure, impaired RV compliance (constrictive pericarditis, cardiac tamponade)
- Y-descent
- Represents tricuspid valve opening and right atrial emptying into the RV
Pulmonary Arterial (Capillary) Wedge Pressure
- What is it?2
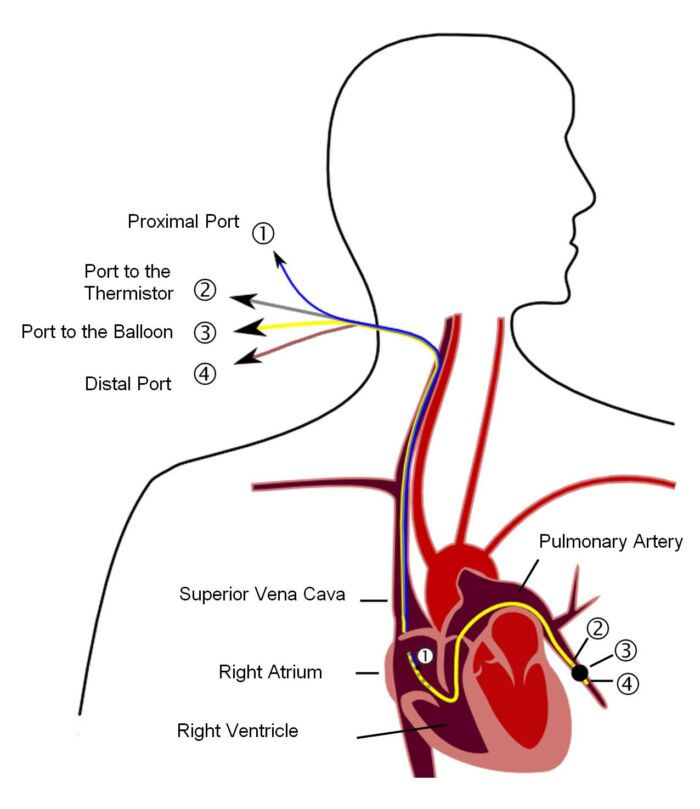
- Pulmonary capillary wedge pressure (PCWP) is the closest approximation to LVEDP. A pulmonary artery (PA) catheter is inserted via a central vein following a path through the RA and RV and wedged in the pulmonary vasculature with the balloon inflated (Figure 2). During end-diastole, there is cessation of forward blood flow, and a static fluid column is presumed to exist from the left ventricle (LV) to the PA catheter tip with no pressure drop.
- Indications2
- Helps differentiate cardiogenic vs. noncardiogenic shock, aids in the management of patients with severe pulmonary HTN, evaluation of RV function, and assessment of the severity of mitral regurgitation in the absence of echocardiography
- Cardiac output (CO) measurement
- Because the PA catheter passes through the right ventricular outflow tract, it is possible to accurately approximate CO by assessing the rate of blood flow through the right side of the heart.
- Techniques to measure the flow rate are based upon the concept of measuring the dilution of some known quantity of an indicator by the passing of blood. Indicators include:
- Dye
- O2 content (Fick method)
- CO2 content (indirect Fick method)
- Temperature (thermodilution)
- Thermodilution is the most commonly used technique in clinical practice.
- Right-sided CO may not equal left-sided CO in the presence of intracardiac shunts.
- What can affect PCWP?2
- Mitral valve obstruction (stenosis, atrial myxoma, clot) can interfere with the ability of PCWP to reflect LVEDP. PCWP will be elevated in these cases.
- Other examples of when PCWP does not accurately reflect LVEDP:
- Decreases in left atrial (LA) or LV compliance
- Left-to-right intracardiac shunting
- Mitral regurgitation
- Aortic insufficiency
- Premature closure of mitral valve
- Downsides of PA catheter monitoring
- PA catheters have not been shown to improve morbidity and mortality outcomes in critically ill patients.3
- In addition to the adverse effects associated with central line placement, adverse effects specific to placement of a PA catheter include:2
- dysrhythmias during placement (including ventricular tachycardia, ventricular fibrillation);
- right bundle branch block (which can precipitate complete heart block in patients with pre-existing left bundle branch block); and
- pulmonary artery rupture.
- It is important that clinicians carefully weigh the risks with the benefits of PA catheter monitoring for each individual patient, as well as know how to interpret and apply the resulting data.
References
- Hensley FA, Gravlee GP, Martin DE. Practical Approach to Cardiac Anesthesia. 5th Ed. Philadelphia Wolters Kluwer. Ann Arbor, Michigan. Proquest; 2014: 118-37.
- Connor C, Conley C. Commonly Used Monitoring Techniques. In: Barash PG. et al (ed). Clinical Anesthesia. 8th Ed. Philadelphia; Wolters Kluwer; 2017: 706-30.
- Shah MR, Hasselblad V, Stevenson LW, et al. Impact of the pulmonary artery catheter in critically ill patients: Meta-analysis of randomized clinical trials. JAMA. 2005;294(13):1664-70. PubMed
Copyright Information

This work is licensed under a Creative Commons Attribution-NonCommercial-NoDerivatives 4.0 International License.