Key Points
- Lung volumes describe the volume of air in the lungs at set points in the respiratory cycle. Two or more lung volumes are combined to create lung capacities.
- Compliance measures a system's distensibility. The compliance of the lungs and chest wall is a major determinant of pulmonary ventilation.
- Resistance to airflow in the lungs is determined by compliance, surface tension, and resistance to gas flow. Medium-sized bronchi are the sites with the greatest resistance in the airway.
Lung Volumes
- Lung volumes describe the volume of air in the lungs at set points in the respiratory cycle. They are classified as static or dynamic measurements.1
- Static lung volumes are measured when there is no flow in the airways and are not affected by the rate of airflow.
- Dynamic lung volumes are dependent on the rate of airflow.
- Four named static lung volumes (Table 1) may be added to provide the maximum amount the lungs can be inflated (total lung capacity [TLC]). Two or more lung volumes are combined to generate the four standard lung capacities (Table 2).2

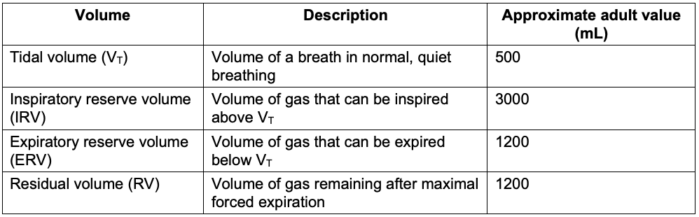
Table 1. Static lung volumes3
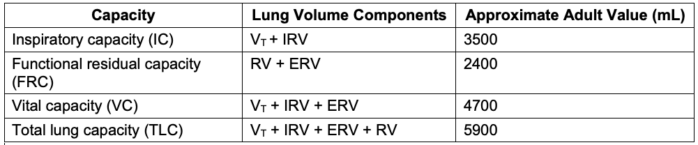
Table 2. Static lung capacities3
- Static lung volumes and capacities may be visualized on a spirogram (Figure 1).
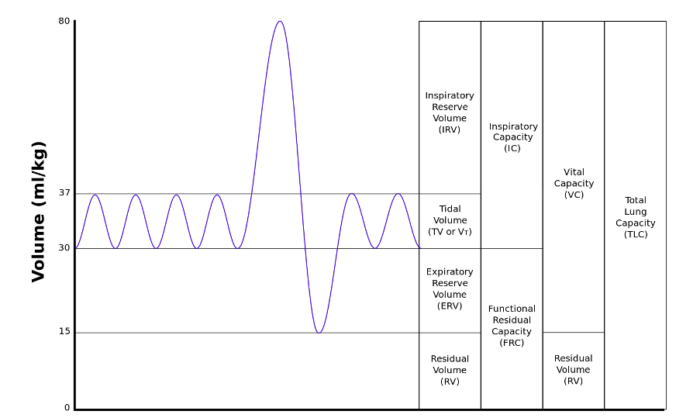
Figure 1. Static Lung Volumes and Capacities on a Spirogram. Source: By Kapwatt at English Wikipedia, CC BY-SA 3.0 Link
- Age, gender, height, weight, and fitness are the primary physiological determinants of static lung volumes and capacities.1
- Lung volumes increase gradually from birth to adulthood. After age 35, gradual changes in lung compliance and alveolar recoil result in increased RV and FRC and decreased IC and VC.1
- Males typically have higher static lung volumes and capacities, likely due to larger anthropometric measurements.1
- Greater height is associated with higher static lung volumes and capacities.1
- Increased body weight is associated with lower lung volumes in obese individuals. Central obesity decreases chest wall compliance, markedly decreasing FRC and ERV and modestly decreasing TLC and TV.1
- Lung volumes are positively correlated with physical activity and regular exercise.1
- The static lung volumes, except for residual volume (and, by extension, lung capacities that include residual volume), may be measured with spirometry (Figure 2a).3
- Measurement of residual volume, functional residual capacity, and TLC may be obtained with nitrogen washout, helium dilution, or whole-body plethysmography (Figure 2b).2,3
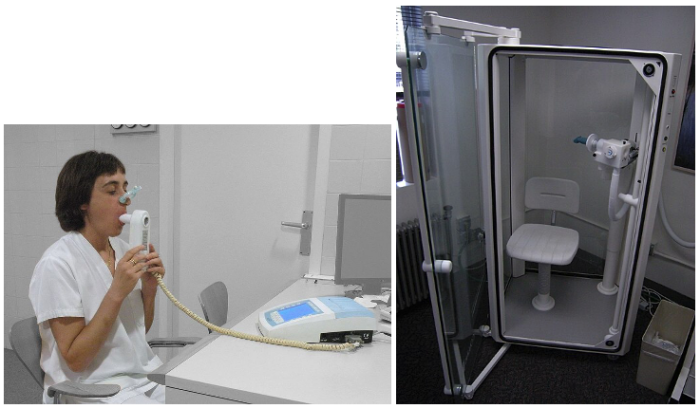
Figure 2a. Obtaining lung volumes with a spirometer. Source: By Jmarchn at Wikimedia Commons, CC BY-SA 3.0, Link; Figure 2b: A body plethysmography chamber. Source: by Joe Mabel at Wikimedia Commons, Link CC BY-SA 3.0
- Functional residual capacity is the volume of air remaining in the lungs at the end of normal exhalation. It represents the point where the inward elastic pull of the lung equals the outward elastic pull of the chest. Therefore, both factors contribute to the point where normal breathing occurs.2
- The elastic fibers of lung tissue, contractile forces of airway smooth muscle, and the surface tension of alveoli all contribute to the inward force of the lung.
- The ribs, joints, and muscles determine the outward force of the chest wall.
- Closing capacity (CC) is the volume of air that remains in the lungs when the small airways lacking cartilaginous support begin to close.1,2
- The difference between CC, when the small airways begin to close, and RV, when all small airways are closed, is the closing volume.1
- At lung volumes below CC, intrapulmonary shunting of deoxygenated blood occurs in the alveoli distal to the dependent areas, promoting hypoxemia.2
- Closing capacity is typically much less than FRC, but it increases with age at a greater rate than FRC.2
- Closing capacity is likely to exceed FRC in the supine position after 44 years and the seated position at 75 years.1
- Dynamic lung volumes are typically assessed with forced vital capacity (FVC) and forced expiratory volume in 1 second (FEV1).2,4
- FVC is the volume of gas that can be exhaled as forcefully and quickly as possible after maximal inspiration.2
- FEV1 is the maximum amount of air that can be exhaled in the first second of FVC. It is often expressed as a percentage of the expected baseline for the patient’s demographic and physical characteristics.4
- The ratio of FEV1/FVC is a useful clinical indicator for distinguishing between restrictive and obstructive lung pathology.4 Normally, FEV1/FVC is 80% or greater.
- While FEV1 and FVC are effort dependent, forced mid-expiratory flow (FEF25-75%) or maximum mid-expiratory flow rate (MMF 25-75%) is effort independent and is a more reliable measurement of obstruction.
- Lung volumes and capacities change in characteristic patterns in obstructive and restrictive lung conditions (Table 3).
- Restrictive lung diseases may be due to causes intrinsic to the lung parenchyma, such as interstitial lung disease, pneumonia, or surfactant deficiency, or extrinsic causes, such as respiratory muscle weakness, chest wall deformities, cardiomegaly, hemothorax, or pneumothorax.1
- Obstructive lung disease causes include bronchial asthma, emphysema, chronic bronchitis, and bronchiectasis.1
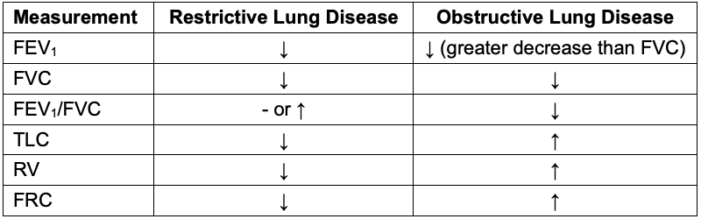
Table 3. Changes in common pulmonary parameters in restrictive and obstructive conditions1,5
Lung Compliance
- Compliance refers to the distensibility of a system. It is the measure of change in volume divided by the change in distending pressure.2,3

-
- In the respiratory system, the compliance of the lungs and chest wall is a form of elastic resistance to airflow and is a major determinant of pulmonary ventilation.1,2
- Compliance is inversely correlated with the property of elastance.3
- Lung compliance is the change in lung volume divided by the change in transpulmonary pressure:

- As with lung volumes, lung compliance may be measured in static or dynamic conditions.1
- Lung compliance is typically 150-200 mL/cm H2O and may be influenced by lung volume, pulmonary blood volume, and extravascular lung water.2
- The pressure-volume (P-V) curve of the lungs during breathing demonstrates dynamic lung compliance. The curves for inspiration and expiration are discrete, with greater lung volume during expiration than inspiration for a given intrapleural pressure. This demonstrates the phenomenon of hysteresis (Figure 3).1
- Hysteresis of lung P-V curves may be explained by surface tension at the air-liquid interface.3
- During early inspiration, lung volumes are low, liquid molecules are close together, intermolecular forces are at their highest, and compliance is low. Surfactant distribution by type II pneumocytes also lags behind the expansion in lung surface area, contributing to low compliance. Compliance increases as inflation progresses and surfactant density increases.3
- The inflection point (Figure 3, point A) of the P-V curve represents the point at which most alveoli have been recruited. Past the inflection point, there is a greater increase in volume for a given change in pressure.6
- Similarly, during early expiration, intramolecular forces between the liquid molecules in the lungs are low, and surfactant removal lags behind the decrease in volume, maintaining high compliance. As expiration proceeds, surfactant is removed, and compliance decreases.1,3
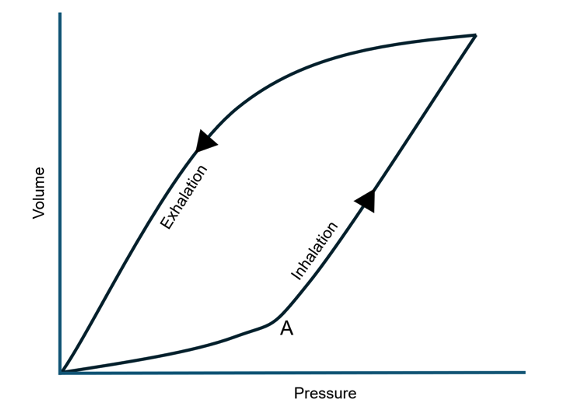
Figure 3. Dynamic pressure-volume curve of the pulmonary system; A is the inflection point
- Chest wall compliance is the change in chest volume divided by the change in intrathoracic pressure.2

-
- Chest wall compliance is typically 200 mL/cm H2O in a healthy individual.2
- The chest wall demonstrates a tendency to pull outward as the lungs are filled to 80% TLC and then recoil inward beyond this level.1
- The normal compliance of the lungs and chest wall together is 100 mL/cm H2O and may be calculated by:

- Various pathological processes may affect the compliance of the lungs and chest wall in a restrictive, obstructive, or combined pattern.1
- Decreased compliance of the lungs, chest wall, or both systems is typically observed in restrictive lung diseases.1
- In obstructive lung diseases, the compliance of the pulmonary system is typically normal or increased if emphysematous changes are present.1
- Increased airway resistance, particularly during the expiratory phase, is the primary defect in obstructive lung disease.1
- Emphysema increases lung compliance due to the loss of normal elastic recoil of the lungs.
- Diseases that decrease chest wall compliance include kyphoscoliosis, pectus excavatum, morbid obesity, skeletal muscle diseases resulting in rigidity or spasticity, and abdominal processes that limit diaphragmatic excursion.
Airway Resistance
- Airway resistance in the respiratory system is comprised of elastic components, including surface tension forces and compliance, as well as the nonelastic component of resistance to gas flow.2
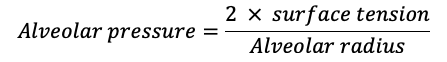
- Surface tension forces in the gas-fluid interface that lines the alveoli tend to favor alveolar collapse.
- Surface tension is described by Laplace’s law:
-
- Pulmonary surfactant moderates the tendency for smaller alveoli to collapse by decreasing surface tension in proportion to its concentration within the alveolus. As the alveolar radius decreases, surfactant concentration increases and surface tension is more effectively reduced.2
- Similarly, as alveolar size increases, surfactant concentration decreases, and surface tension rises, limiting further alveolar expansion.2
- The nonelastic component of airway resistance to gas flow can be divided into laminar and turbulent flow (Figure 4).
- Laminar flow is characterized by a smooth, parabolic gas velocity profile within the airways, with the greatest velocity at the center of the airway.3
- Turbulent flow is characterized by random, radial, and axial air movement.3
- Laminar flow typically occurs distal to the small bronchioles in airways less than 1 mm in diameter, while flow in larger airways is more likely to be turbulent.2
- Turbulent flow is more likely to be observed with higher gas flow, at angles or branch points in the respiratory tree. and abrupt changes in the airway diameter.2
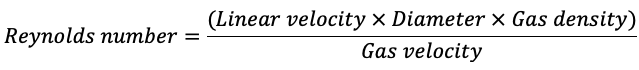
- The Reynolds number predicts whether the flow will be laminar or turbulent. A number <1000 predicts laminar flow, while a number >1500 predicts turbulent flow.2
- Laminar flow in the respiratory system is directly proportional to the pressure gradient between the mouth or nose and alveoli and inversely proportional to the resistance.3

-
- Resistance is determined by Piouselle’s law:

-
- where R is resistance, η is the viscosity of inspired air, l is the length of the airway, and r is the radius of the airway.3
- Turbulent flow is less easily modeled mathematically. In turbulent flow, resistance increases in proportion to gas flow and is directly proportional to gas density and inversely proportional to the 5th power of the airway radius:2

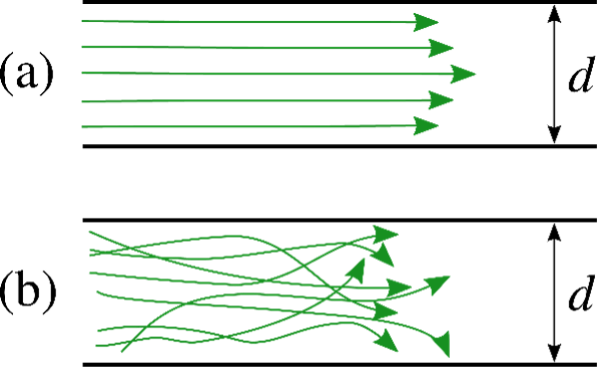
Figure 4. Laminar (a) and turbulent (b) flow. Source: By Dubaj at English Wikipedia, Public Domain. Link
- The site of greatest resistance in the airway is the medium-sized bronchi.
- The small bronchi provide less collective resistance due to their parallel arrangement, resulting in a large total cross-sectional area, and large airways have less resistance due to their large diameters.2,3
References
- Lutfi MF. The physiological basis and clinical significance of lung volume measurements. Multidiscip Respir Med. 2017;12(1):3. PubMed
- Butterworth JF, Mackey DC, Wasnick JD. eds. Chapter 23: Respiratory physiology & anesthesia. In: Morgan & Mikhail’s Clinical Anesthesiology. Seventh edition. McGraw-Hill LLC; 2022.
- Costanzo LS. Chapter 5: Respiratory physiology. In: Physiology. Sixth edition. Elsevier; 2018.
- David S, Edwards CW. Forced expiratory volume. In: StatPearls (Internet). Treasure Island, FL. StatPearls Publishing; 2022. Accessed November 4, 2024. Link
- Edwards Z, Annamaraju P. Physiology, lung compliance. In: StatPearls (Internet). Treasure Island, FL. StatPearls Publishing; 2023. Accessed November 4, 2024. Link
- Butterworth JF, Mackey DC, Wasnick JD. eds. Chapter 58: Inhalation Therapy & Mechanical Ventilation in the PACU & ICU. In: Morgan & Mikhail’s Clinical Anesthesiology. Seventh edition. McGraw-Hill LLC; 2022.
Copyright Information

This work is licensed under a Creative Commons Attribution-NonCommercial-NoDerivatives 4.0 International License.