Key Points
- Sensitivity and specificity measure a test's accuracy in identifying individuals with and without a condition, which is essential for reliable diagnosis.
- Area under the receiver operating curve (AUROC) assesses a diagnostic test's effectiveness, with values near 1 indicating better performance, while AUC values over 0.90 suggest strong clinical relevance.
- Calibration aligns predicted probabilities with actual outcomes, enhancing clinical decision-making reliability and being influenced by factors such as patient demographics and clinical context.
Key Metrics in Diagnostic Accuracy
Sensitivity: Sensitivity, or the true positive rate, measures a test’s ability to correctly identify individuals with the condition. It reflects the proportion of true positives among those who have the disease. High sensitivity is essential for early diagnosis, which can significantly improve outcomes.1


Specificity: Specificity, or the true negative rate, measures a test’s ability to correctly identify individuals without the condition. It reflects the proportion of true negatives among those without the disease. High specificity is crucial for minimizing false positives and reducing unnecessary anxiety and procedures.1

Positive Predictive Value (PPV): PPV is the percentage of positive test results that are true positives, showing the likelihood that a positive result actually means the disease is present. A higher PPV is observed when the disease is more common in the population.1,2

Negative Predictive Value (NPV): NPV is the percentage of negative test results that are true negatives, indicating the likelihood that a negative result truly means the disease is absent. A higher NPV is observed when the disease is rare in the population.1,2

Positive Likelihood Ratio (LR+): LR+ represents the likelihood of a positive test result occurring in individuals with the disease (sensitivity) compared to those without the disease (1 − specificity). A higher LR+ (>10) indicates a strong likelihood that a positive result is a true positive, making it useful for confirming a diagnosis.3

Negative Likelihood Ratio (LR−): LR- represents the likelihood of a negative test result occurring in individuals with the disease (1 − sensitivity) compared to those without the disease (specificity). A low LR− (<0.1) suggests that a negative result is likely a true negative, helping to rule out the disease.3

Unlike predictive values, which vary with disease prevalence, likelihood ratios remain constant regardless of disease prevalence.
Diagnostic Test Performance and AUROC
Area under the receiver operating curve (AUROC): AUROC measures a diagnostic test’s overall effectiveness, ranging from 0 to 1, where values closer to 1 indicate stronger performance. It assesses how well a test can differentiate between diseased and non-diseased subjects by combining sensitivity and specificity across different thresholds. AUC values above 0.90 generally suggest strong clinical relevance, while values below 0.80, though possibly statistically significant, often indicate limited clinical utility.3,4
Types of Diagnostic Studies: Diagnostic studies generally utilize two major approaches according to the type of test result: two-by-two tables for dichotomous results (positive/negative) and ROC analysis when the results are continuous.4
- Two-by-Two Tables: Used when both index and reference tests are dichotomous, this approach calculates sensitivity, specificity, positive predictive value (PPV), and negative predictive value (NPV) (Table 1).3,4
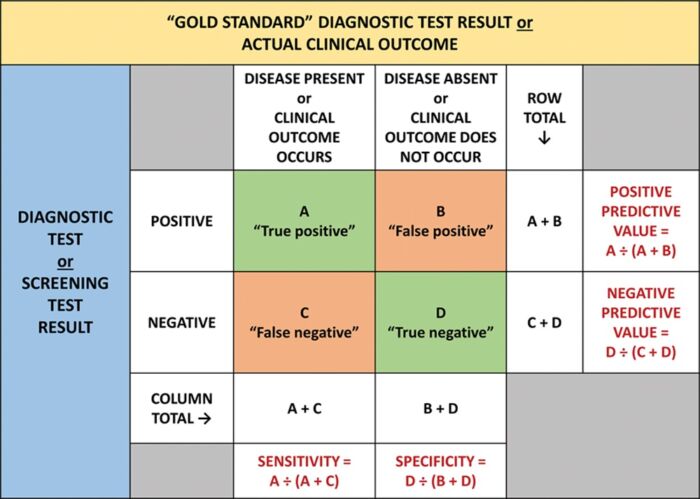
Table 1. A two-by-two table showing the results from a study comparing a dichotomous diagnostic or screening test with a gold standard test or clinical outcome. Used with permission from Vetter TR et al. Anesth Analg. 2018.3
- ROC Analysis: When the test gives continuous results, the ROC analysis evaluates the diagnostic accuracy at multiple cutoffs. This generates a ROC curve, a graph that plots sensitivity against 1-specificity (Figure 1).3 The area under the ROC curve (AUC) measures diagnostic accuracy. Perfect discrimination is represented by 1.0, while random chance is 0.5.4
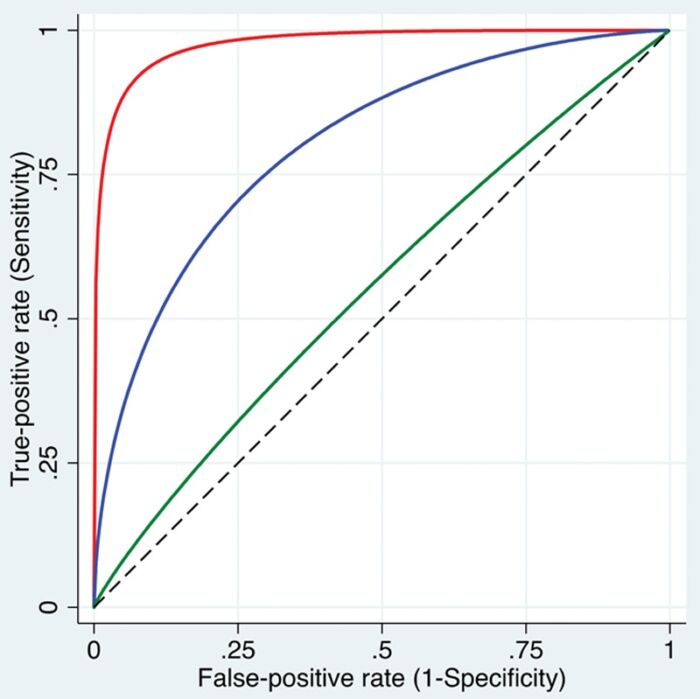
Figure 1. ROC curves. Three smoothed curves are displayed, illustrating varying levels of discriminative ability: high (red curve near the top left corner), intermediate (blue curve), and low (green curve close to the dashed diagonal line) in distinguishing patients with the condition from those without it. Used with permission from Vetter TR et al. Anesth Analg. 2018.3
Designing a Diagnostic Accuracy Study
- Designing a diagnostic accuracy study requires clear objectives, a well-defined patient population, and careful selection of a gold standard for comparison. Imperfect gold standards can be used and accounted for by using statistical measures.3
- Sample size depends on the study’s goal (e.g., estimating accuracy or comparing biomarkers) and disease prevalence, with sensitivity driving calculations in low prevalence (less than 50%) and specificity in high prevalence (more than 50%).3
Calibration and Its Role in Diagnostic Accuracy
- Calibration refers to the alignment of predicted probabilities from a diagnostic test with actual outcomes, reflecting how closely the model’s probabilities match the true likelihood of disease in the population studied. A well-calibrated test enhances the reliability of clinical decision-making by accurately indicating disease risk based on test results.5
- Calibration can be influenced by factors such as temporal changes (new patient demographics over time), geographic differences (patients in various healthcare settings), and domain validation (applying risk predictions in appropriate clinical contexts).5
References
- Monaghan TF, Rahman SN, Agudelo CW, et al. Foundational statistical principles in medical research: Sensitivity, specificity, positive predictive value, and negative predictive value. Medicina (Kaunas). 2021;57(5):503. PubMed
- Safari S, Baratloo A, Elfil M, et al. Evidence-based emergency medicine: Part 2: Positive and negative predictive values of diagnostic tests. Emerg (Tehran). 2015;3(3):87-8. PubMed
- Vetter TR, Schober P, Mascha EJ. Diagnostic testing and decision-making: Beauty is not just in the eye of the beholder. Anesth Analg. 2018;127(4):1085-91. PubMed
- Çorbacıoğlu ŞK, Aksel G. Receiver operating characteristic curve analysis in diagnostic accuracy studies: A guide to interpreting the area under the curve value. Turk J Emerg Med. 2023;23(4):195-8. PubMed
- Walsh CG, Sharman K, Hripcsak G. Beyond discrimination: A comparison of calibration methods and clinical usefulness of predictive models of readmission risk. J Biomed Inform. 2017; 76:9-18. PubMed
Copyright Information

This work is licensed under a Creative Commons Attribution-NonCommercial-NoDerivatives 4.0 International License.